Objective of Pharma Marketer Survey Report
Indegene’s latest global survey analysis – “The Digital Savvy Pharma Marketer 2020”- provides insights into the latest channel preferences, technology utilization, and content strategies across different levels of marketing organizations in pharmaceutical companies. Marketers can use the survey results as a tool to:
Guide budgeting and brand planning exercise
Support strategy formulation around channel selection and content optimization
Benchmark/validate marketing mix and digital channel utilization
Help drive maximum value by enabling better customer experience through orchestrated customer journeys
Executive Summary
Advancements in technology are redefining marketing practices in the pharmaceutical industry. Traditional channels such as television and radio are unable to provide on-demand information to a new generation of healthcare professionals, who are as comfortable with a stethoscope as they are with a smartphone and are moving the marketing needle.
In line with this vision, pharma organizations, although initially perceived as reluctant adopters, are riding on the wave of digital evolution. They cannot risk standing on the periphery anymore by only providing transactional and point-in-time solutions. Hence, pharma marketers are exploring a multitude of digital initiatives to deliver personalized content through a physician’s preferred channel at a time of their choosing.
Digitalization is yet to fundamentally transform the marketplace; however, digital touchpoints have become an essential pillar for customer engagement. Additionally, the use of images and microcontent by marketers, given the short attention spans of physicians, has seen marketers lean toward the employment of a whole suite of tools and applications for digital engagement.
Indegene’s latest global survey analysis – “The Digital Savvy Pharma Marketer 2020”- confirms the trend of increasing digital spend to keep up with changing industry dynamics. Key insights include:
The average allocation toward digital channels from overall marketing budget reached a peak of 34% this year, twice the 2016 allocation figures
About 20% respondents foresee an increase in their digital spend by more than 50% over the next 3 years
Digital channels deliver 24% higher productivity as compared to traditional channels such as TV/radio to engage patients
Key opinion leader webinars, social media, and marketing emails are viewed as the most effective digital channels to engage healthcare professionals
Personalization of content has become a key focus area to maximize value for customers.
Respondent Analysis
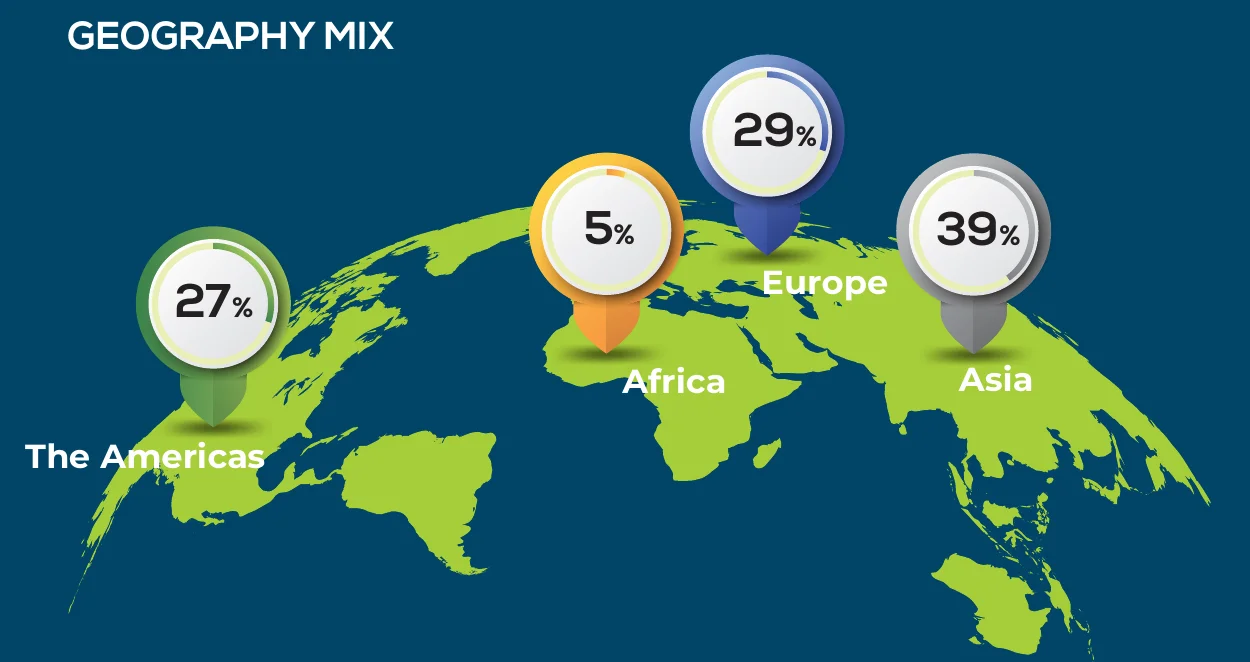
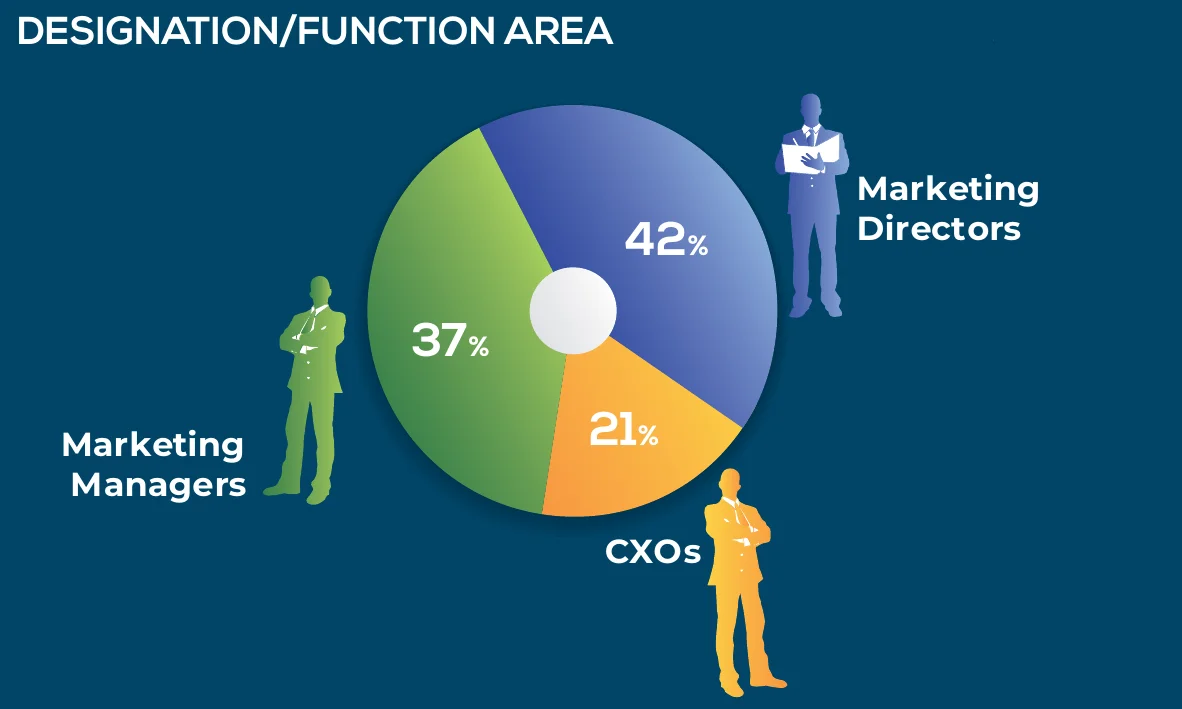
The findings presented in this survey report are an analysis of aggregate responses of 100+ participants across the Americas, Europe, and Asia and includes marketers from top 100 pharma and bioscience organizations.
Primary Research
Channel Preferences and Effectiveness
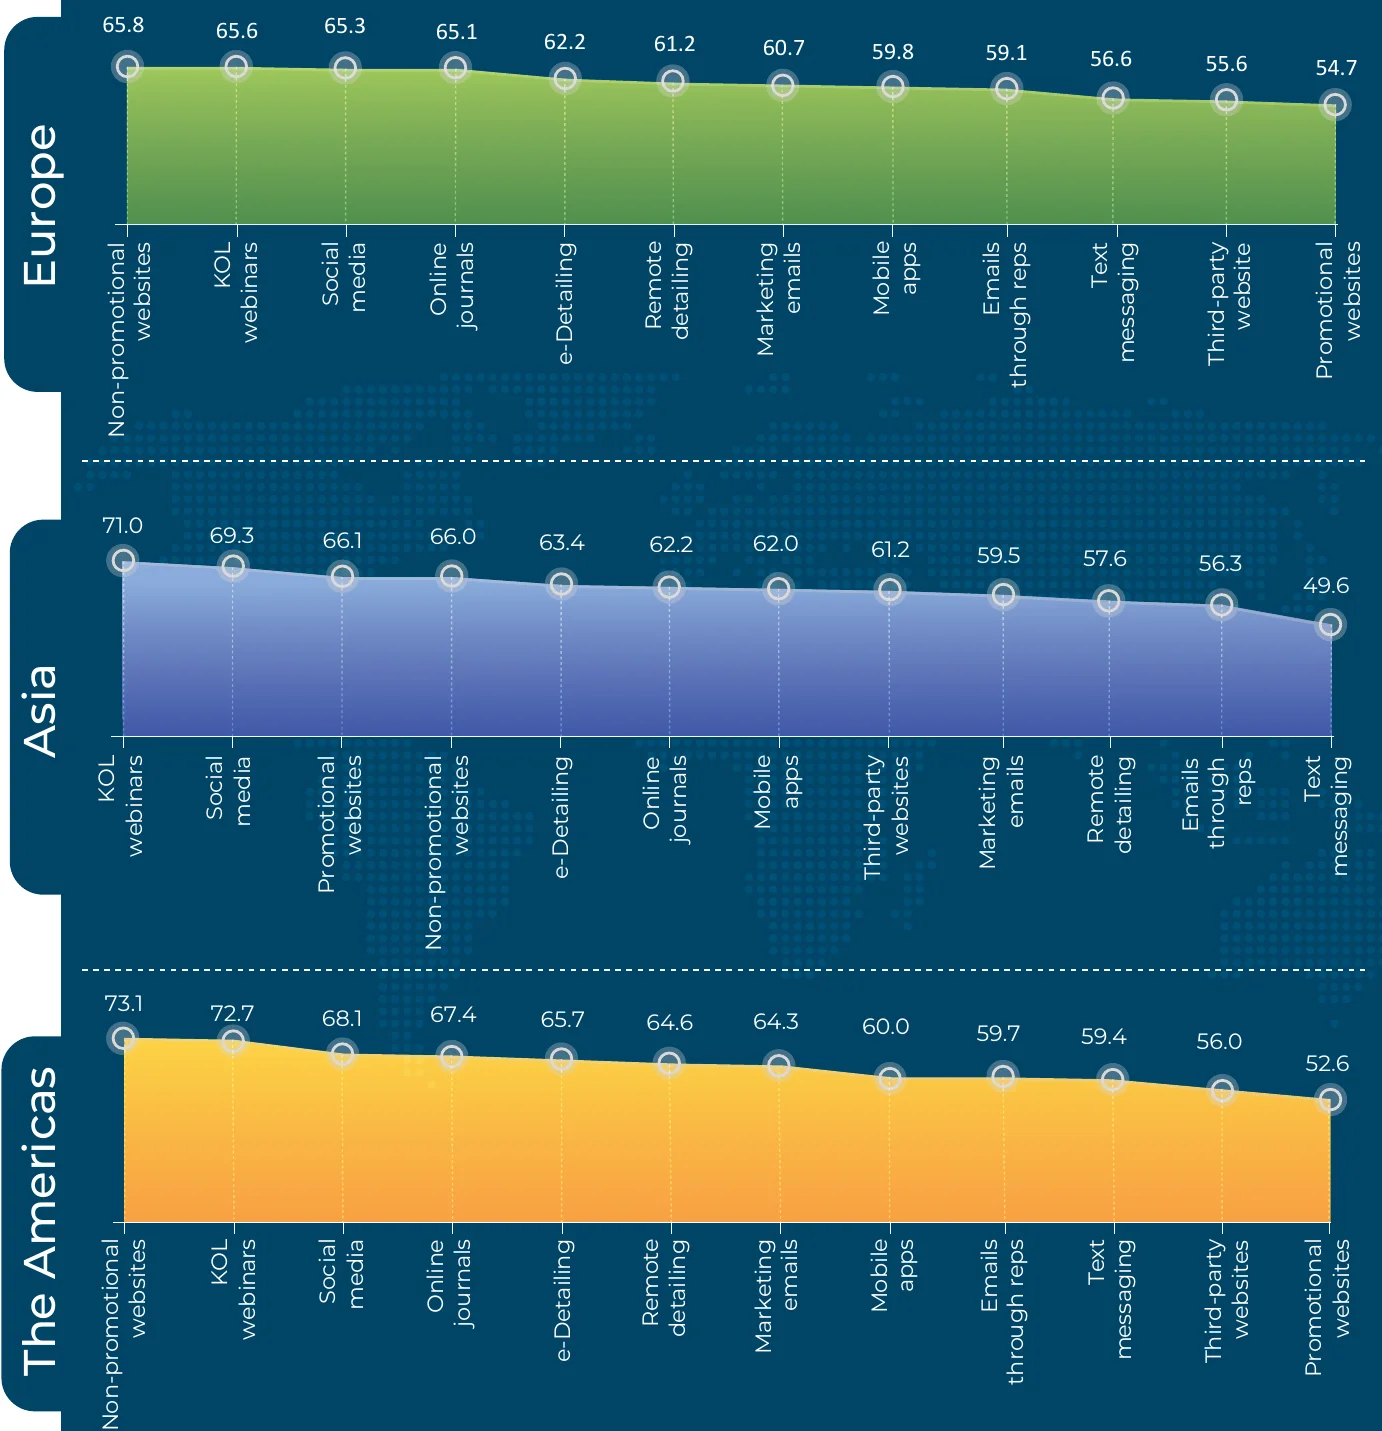
Channels preference: Called-on marketing
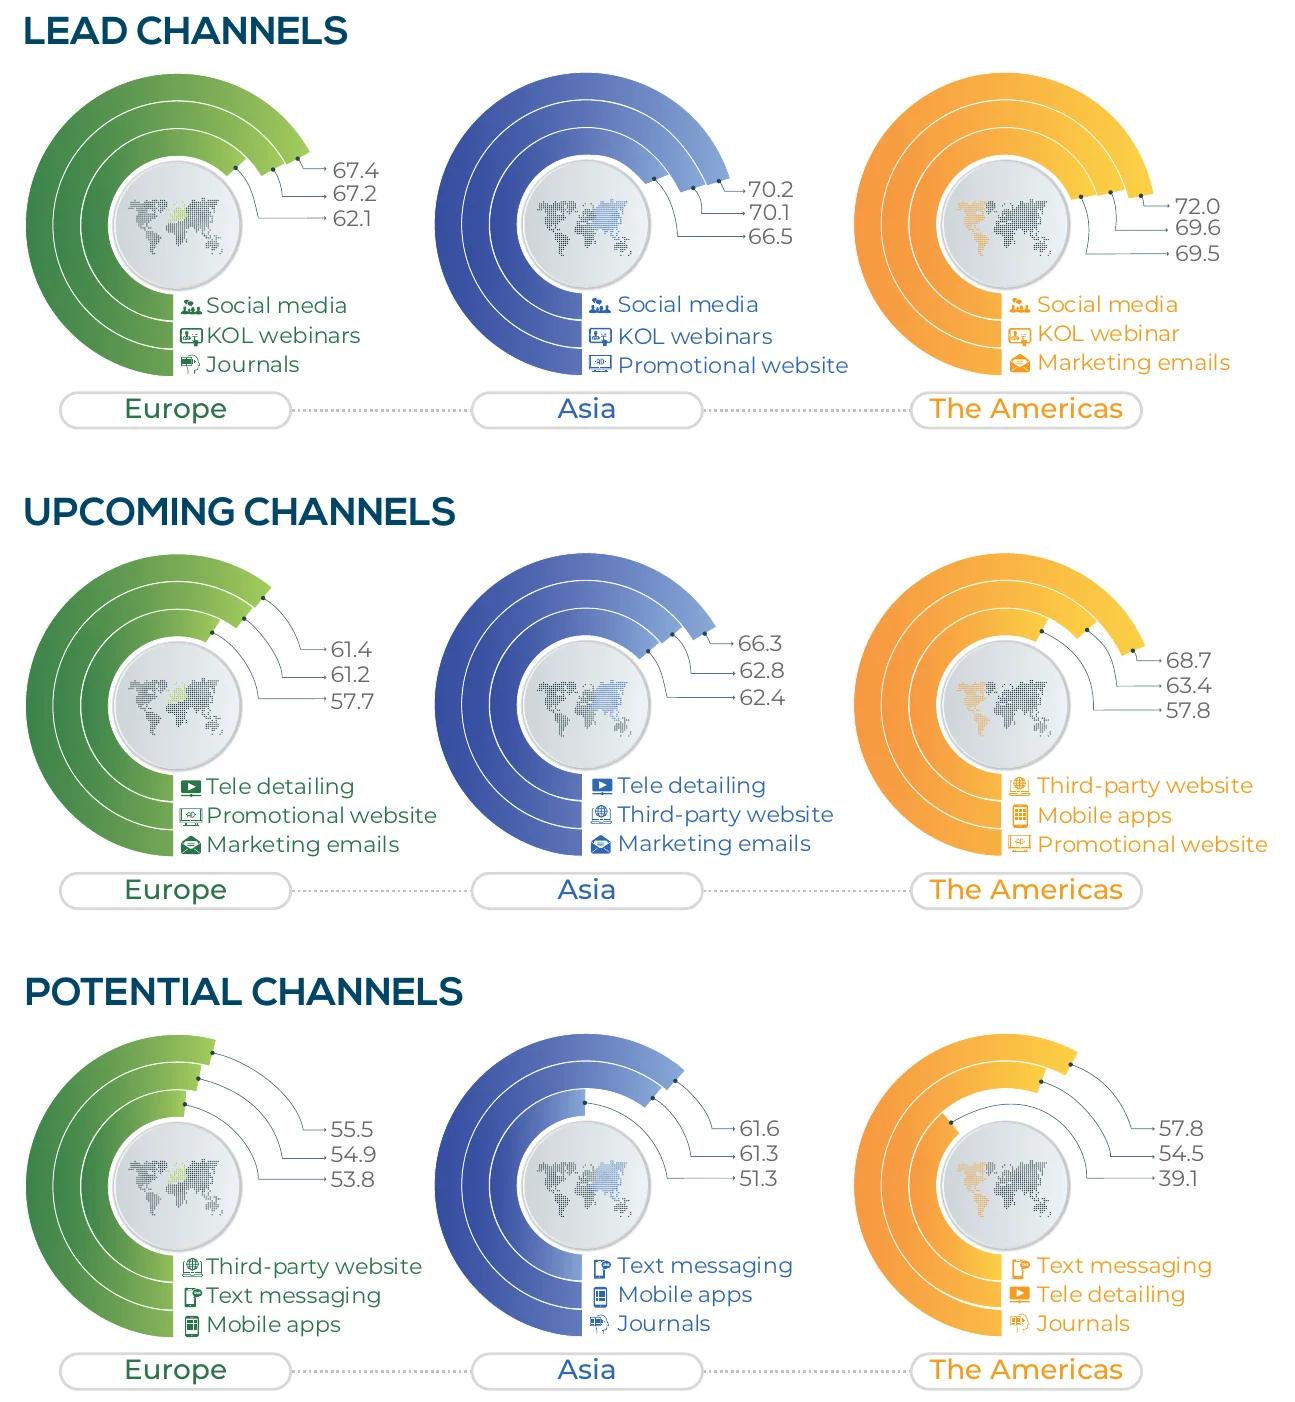
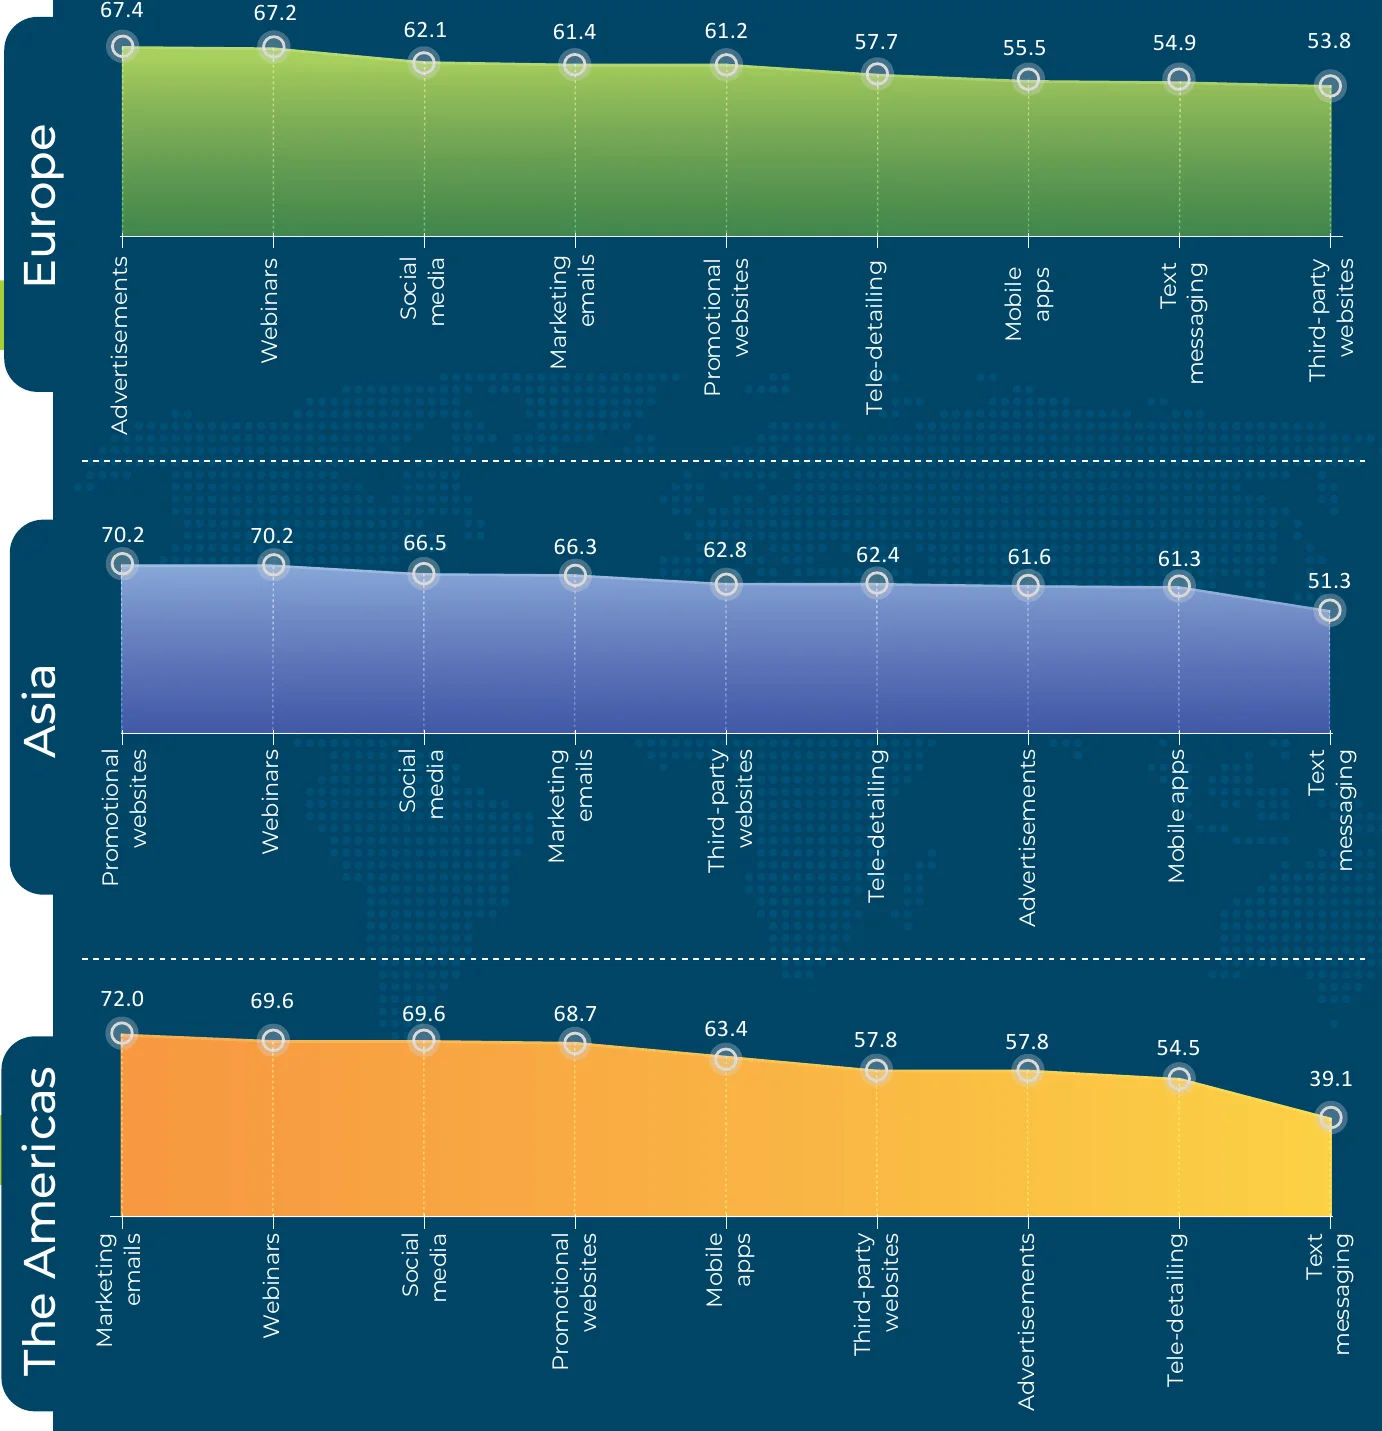
Channel preference: White space marketing
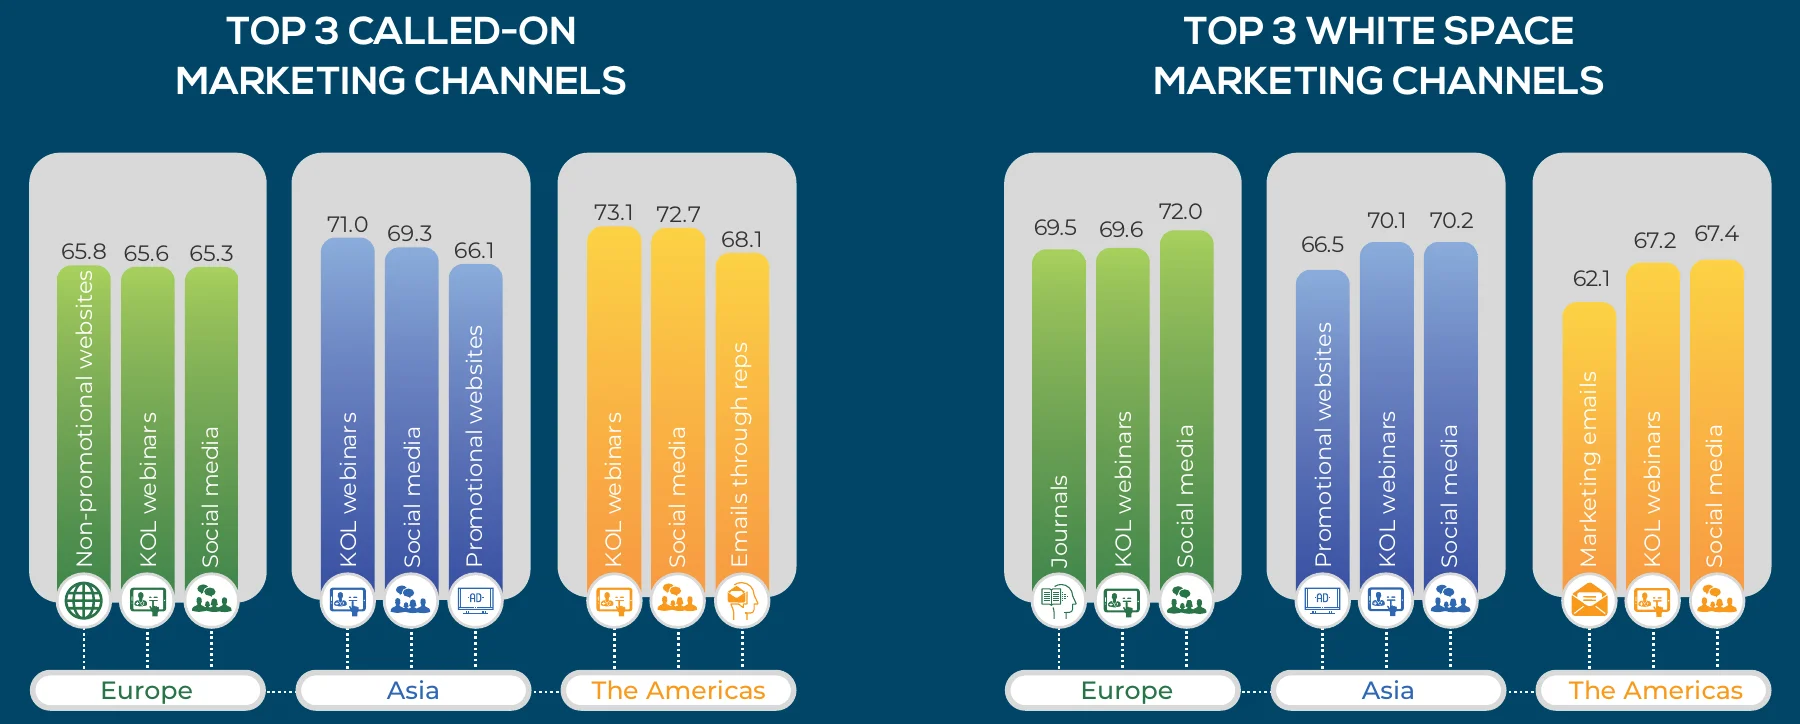
Called-on vs white space marketing trends
Channel Preference // Called-on Marketing
Key Takeaways:
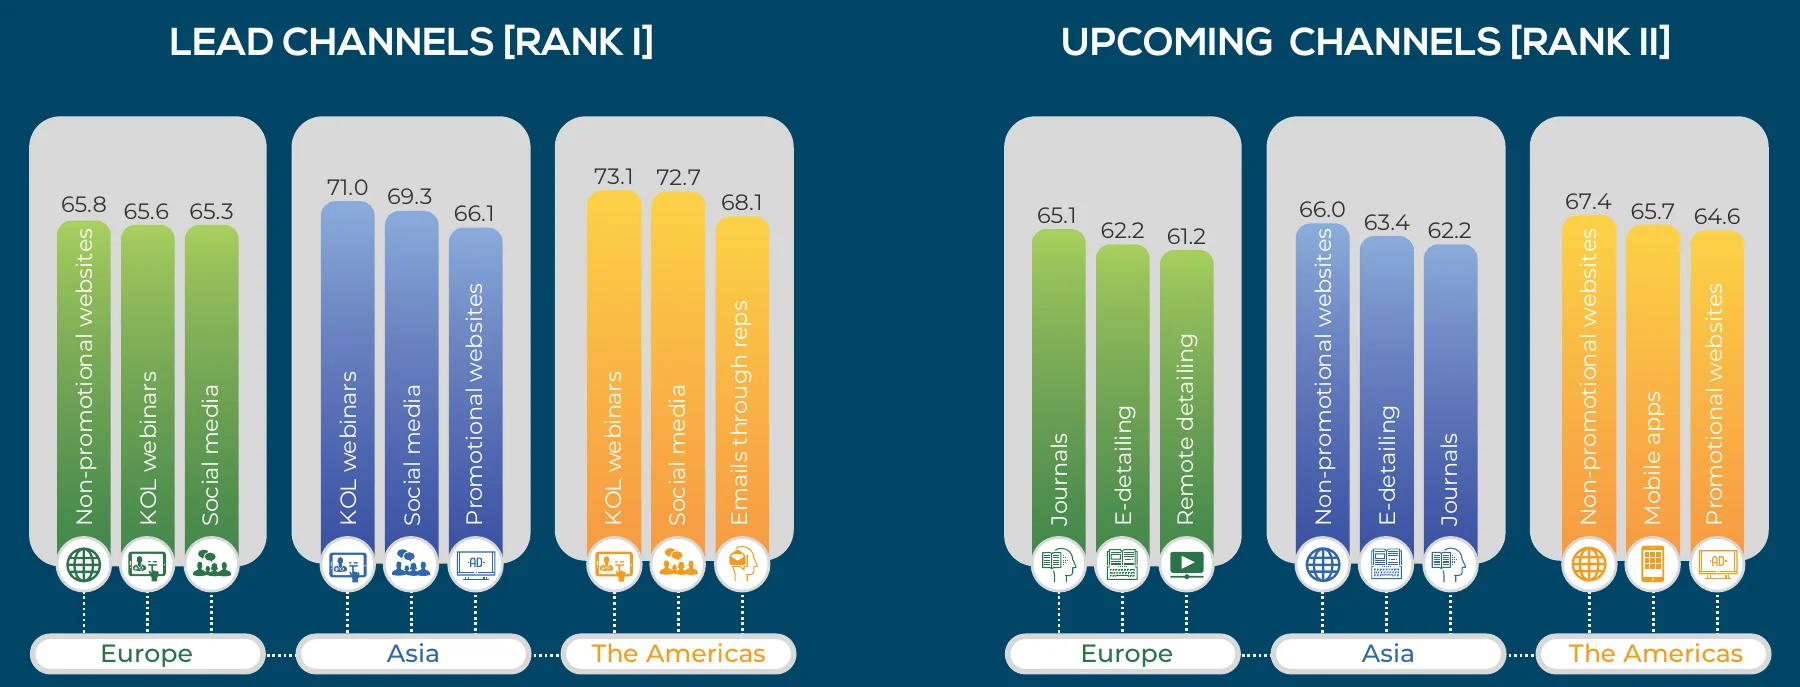
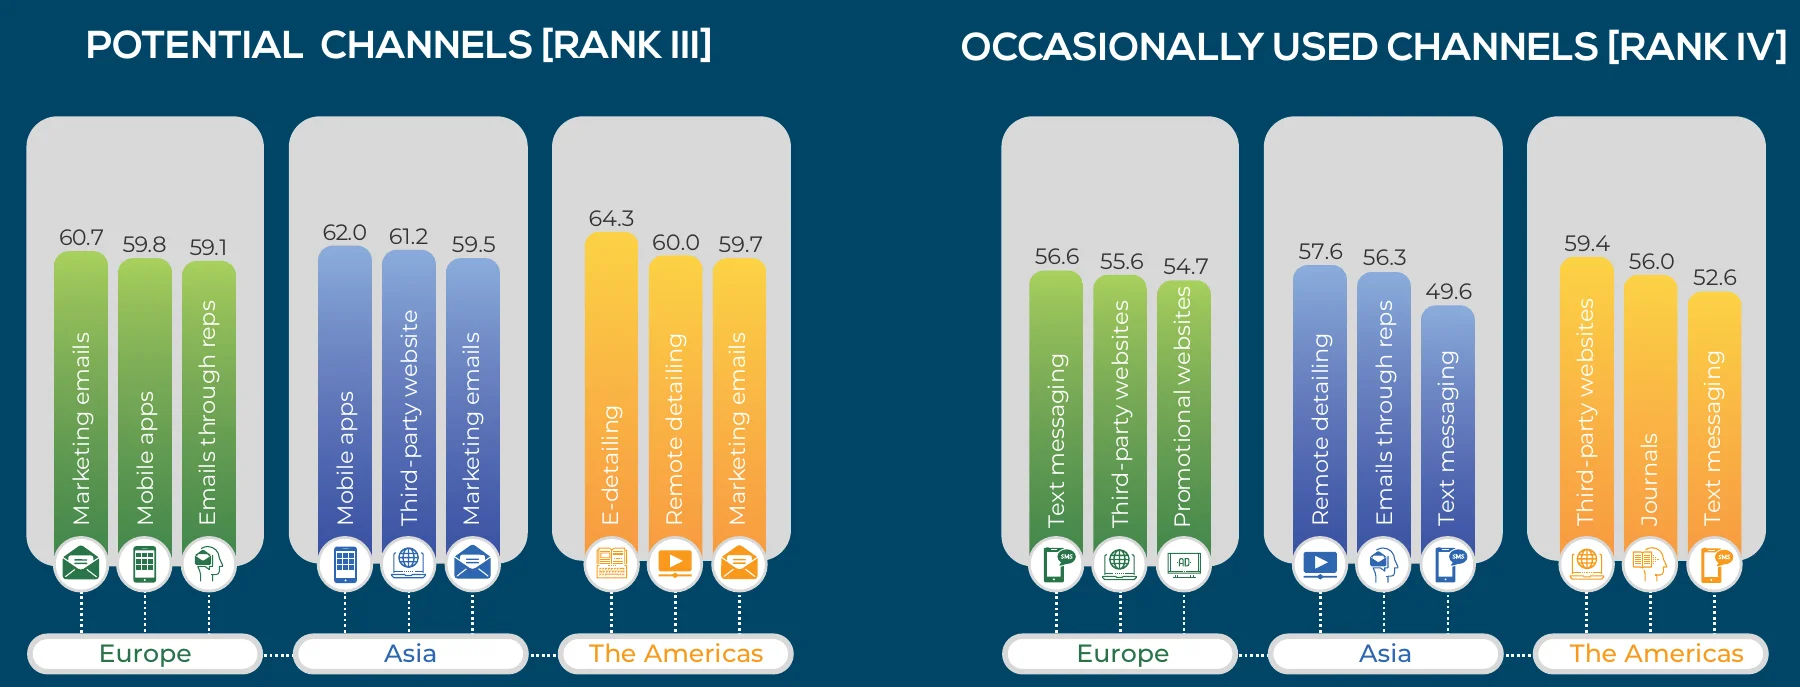
With the increase in consumption of digital content among HCPs, it is not surprising to note that social media ranks among the top three channels across all regions for pharma marketers to engage with HCPs.
At the global level:
Top lead channels: Key opinion leader (KOL) webinars and social media
Top upcoming channel: Marketing emails
Top potential channels: Journals and non-promotional websites
Top occasionally used channel: Text messaging
Region Specific
Channel Preference // White Space Marketing
Key Takeaways:
The top four preferred channels to drive awareness and product updates among HCPs in white space areas include key opinion leader (KOL) webinars, social media, marketing emails, and promotional websites. Peer promotion continues to be a critical driver for pharma companies to raise the profiles of their products
Marketers continue to use promotional websites rather than native apps to deliver content, confirming with physicians' preference to use laptops or personal computers to access new content (as discovered in another Indegene study – The Digital Savvy HCP Survey 2019)
Region Specific
Called-on vs White Space Marketing Trends
Key Takeaways:
KOL webinars rank among the top 3 channels across all regions in both called-on as well as white space marketing channels. It is the channel of choice for marketers
Primary Research
Digital Marketing Budget Allocations
Current Trends
The Americas: Channel Spend and Budget Allocations
Asia: Channel Spend and Budget Allocations
Europe: Channel Spend and Budget Allocations
Digital Marketing Budget Allocation // Current Trends
Key Takeaways:
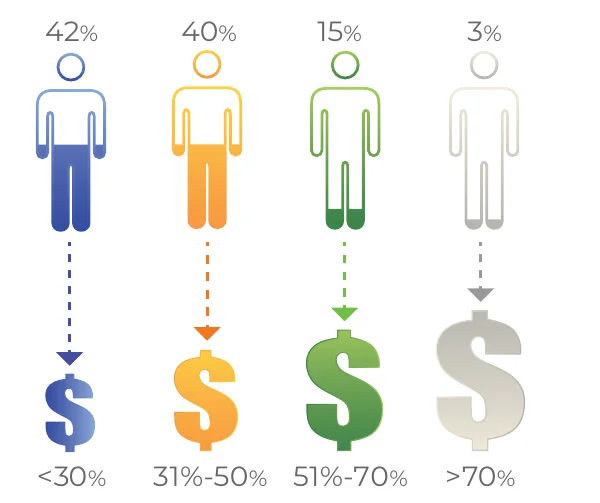
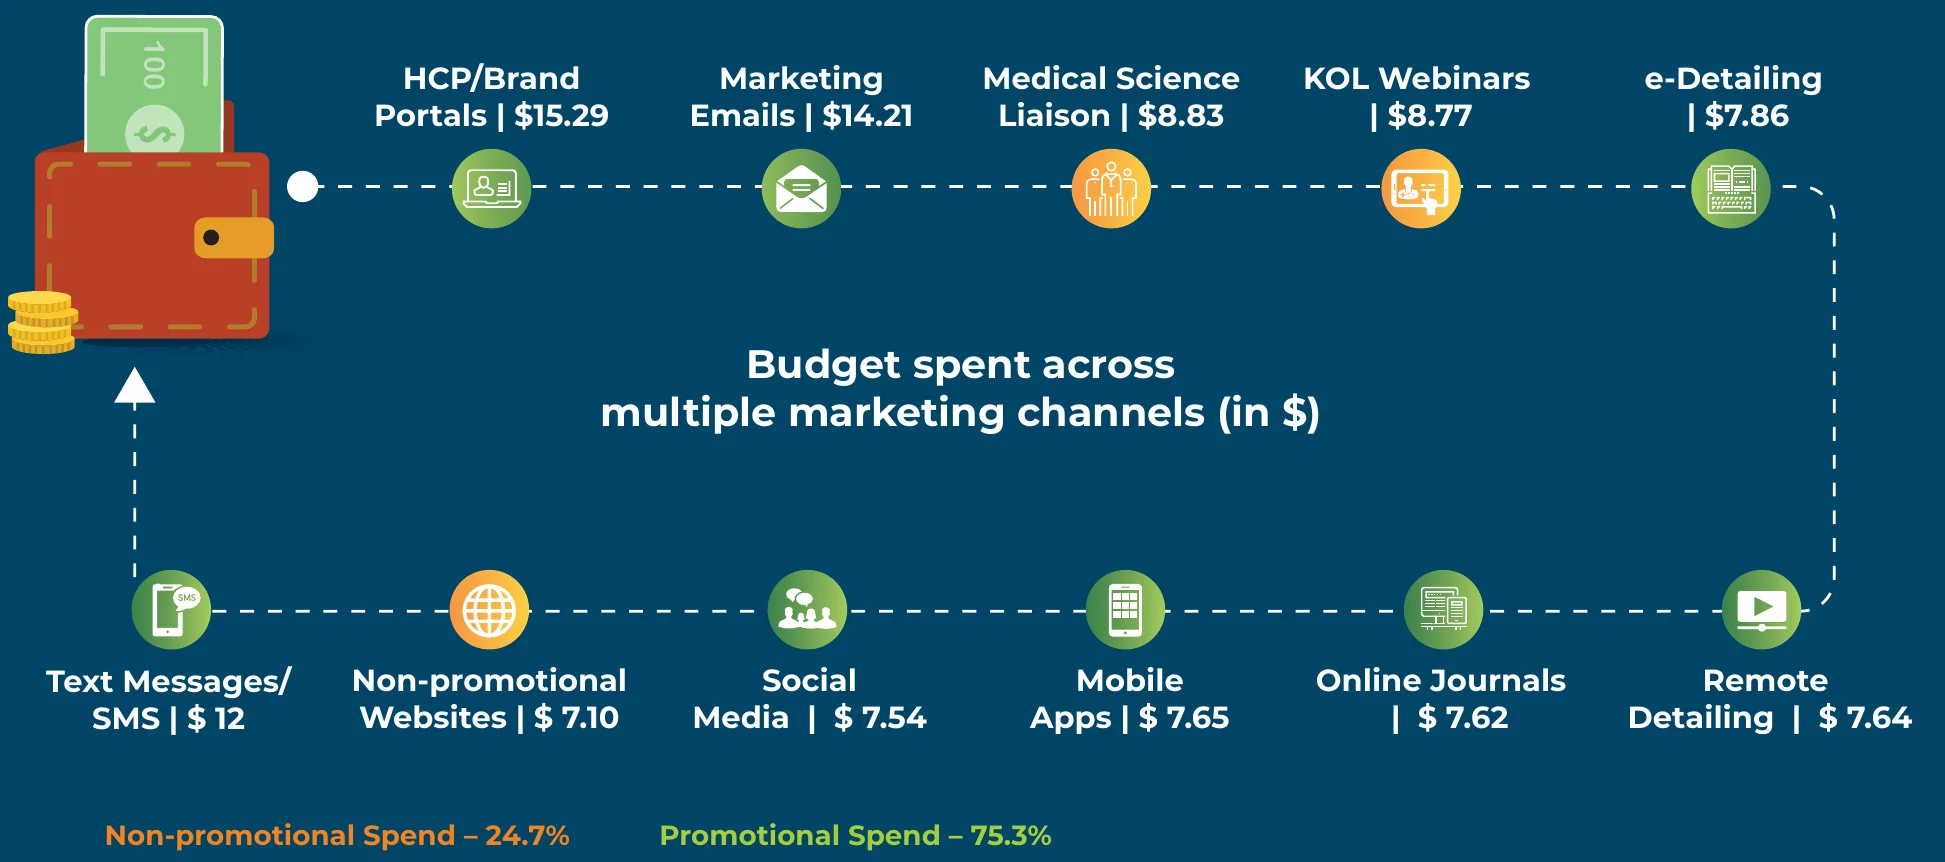
On an average, leading pharma organizations spend approximately 34% of total marketing budget on digital channels.
Millennial HCP preferences play a key role in influencing the decisions made by marketers as smartphone and tablet usage continues to increase significantly
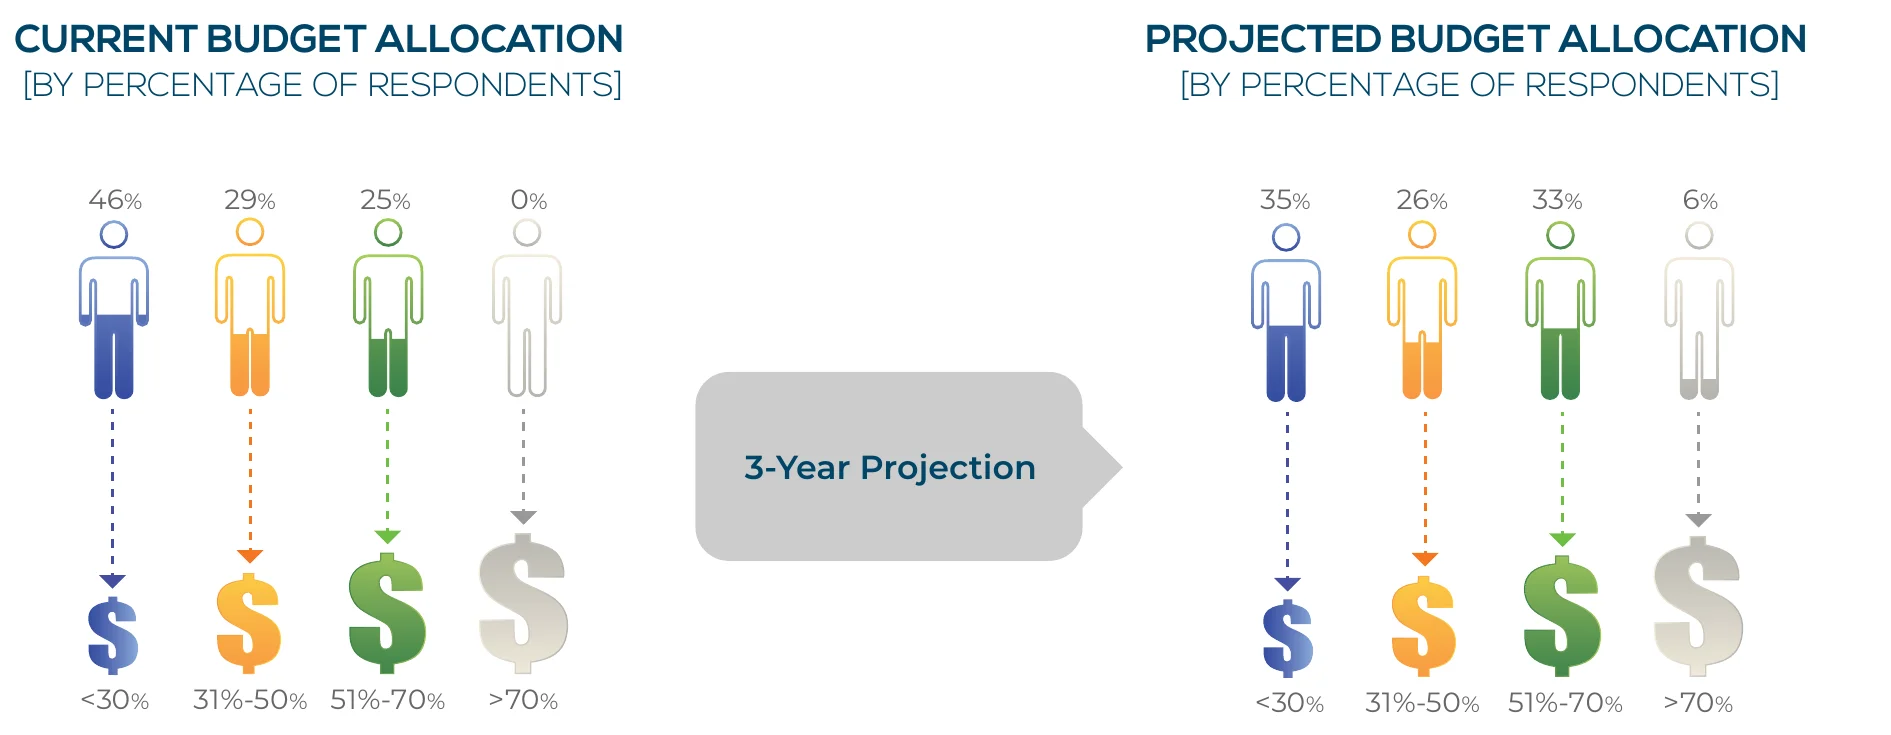
About 20% respondents foresee over 50% increase in their digital spend over the next 3 years
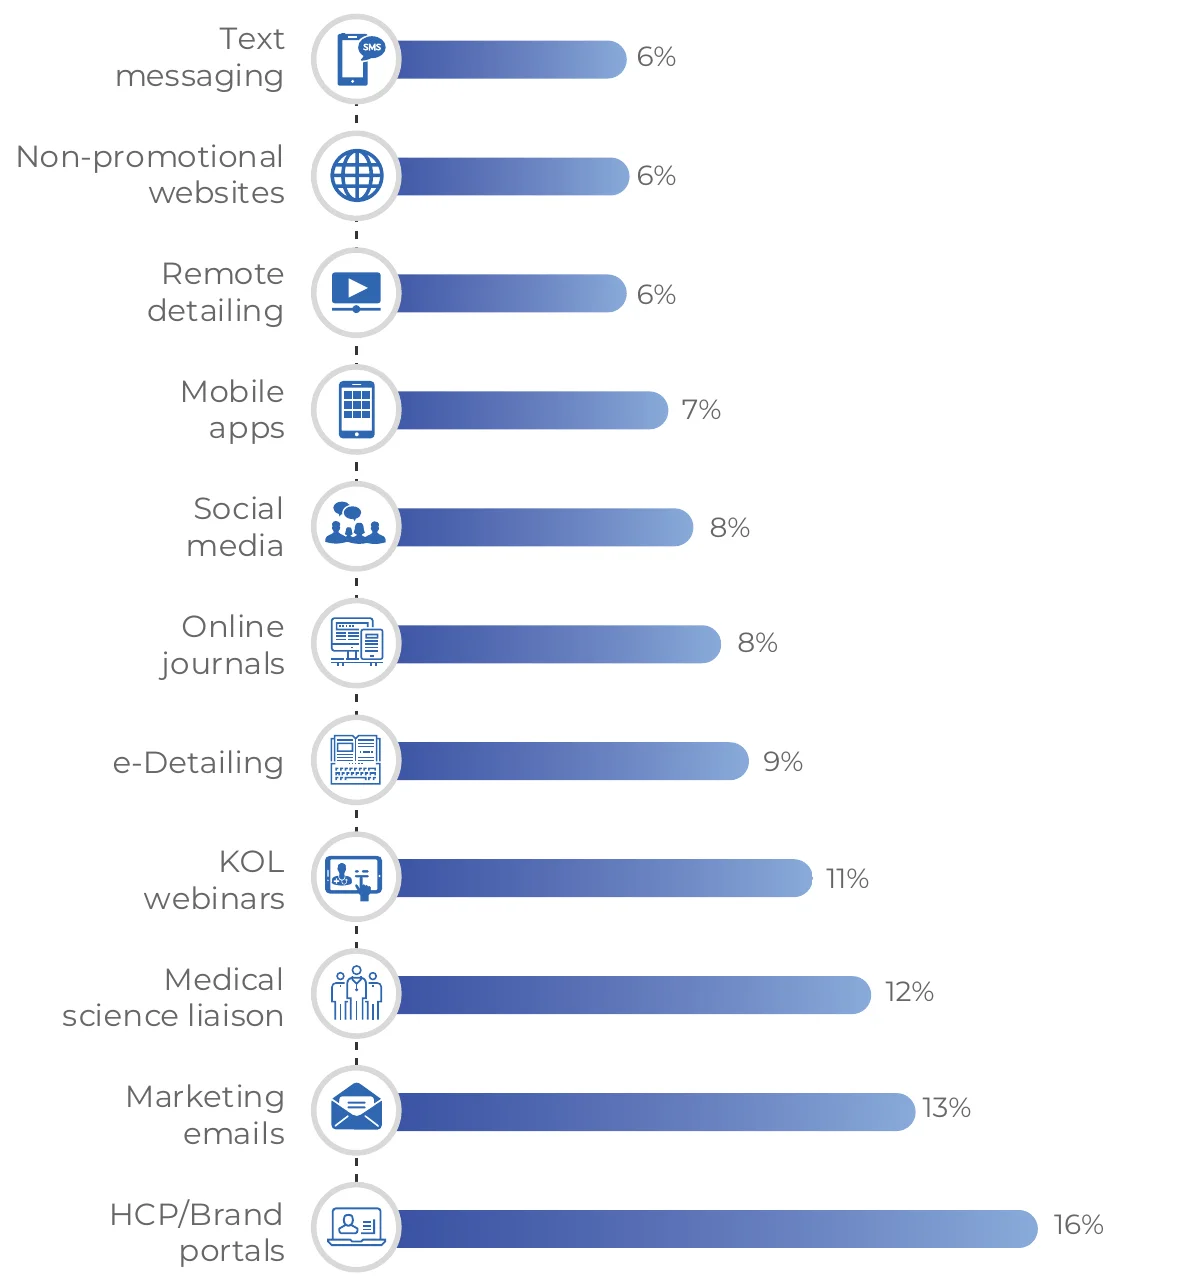
Current Spend Across Digital Channels [By Percentage of Respondents]
Digital Marketing Budget Allocation // The Americas
Channel Spend
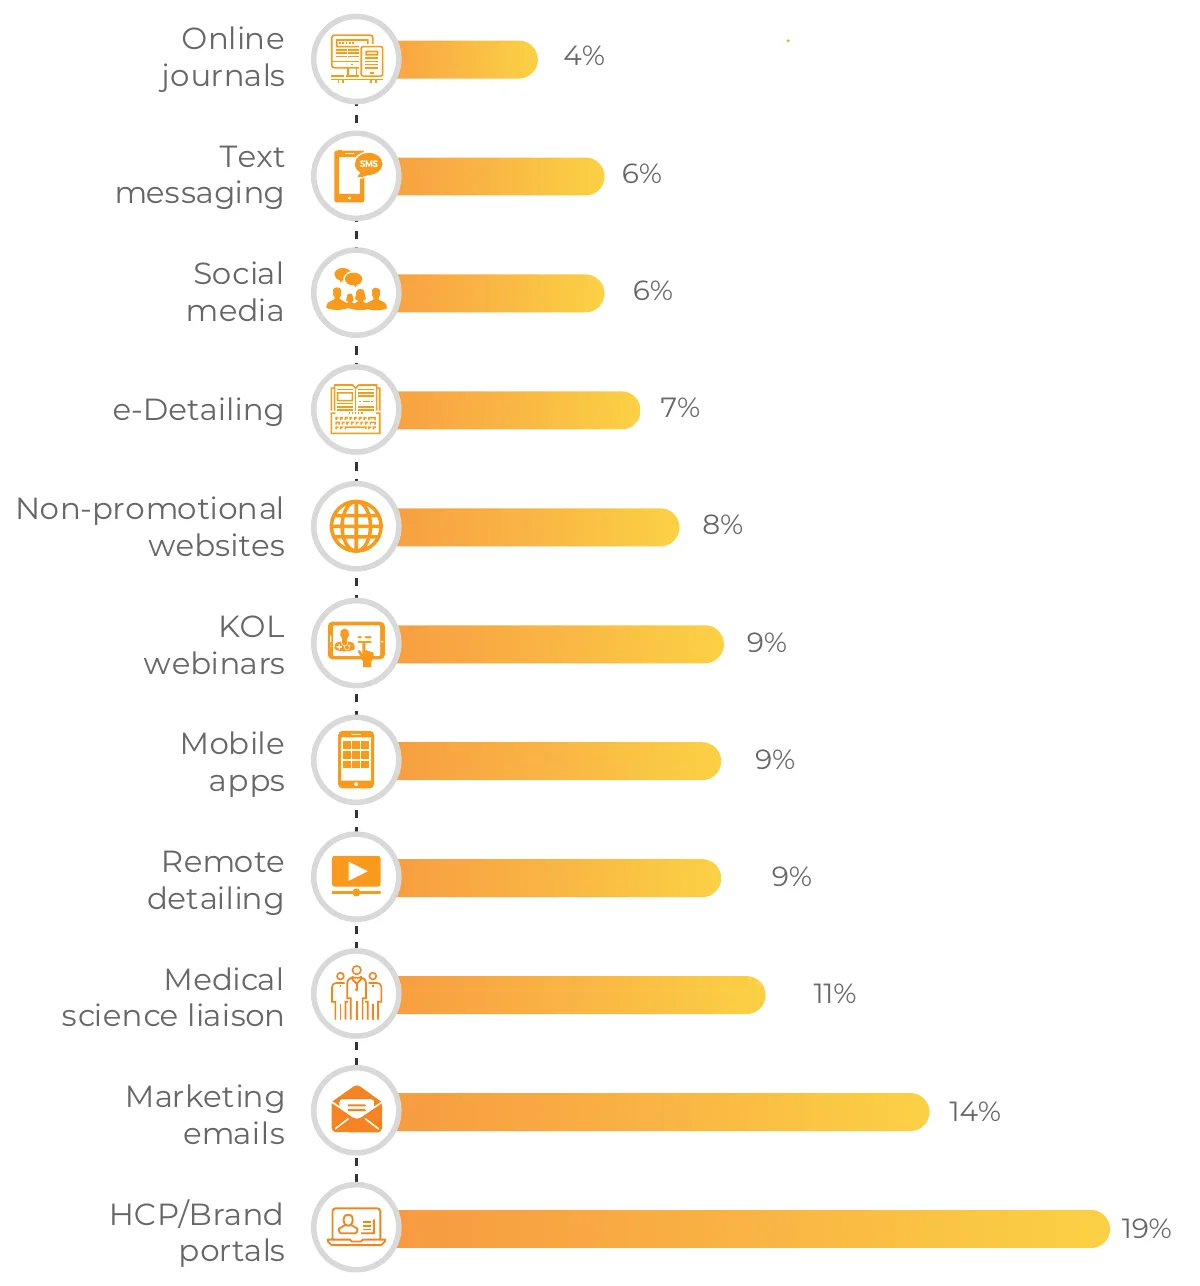
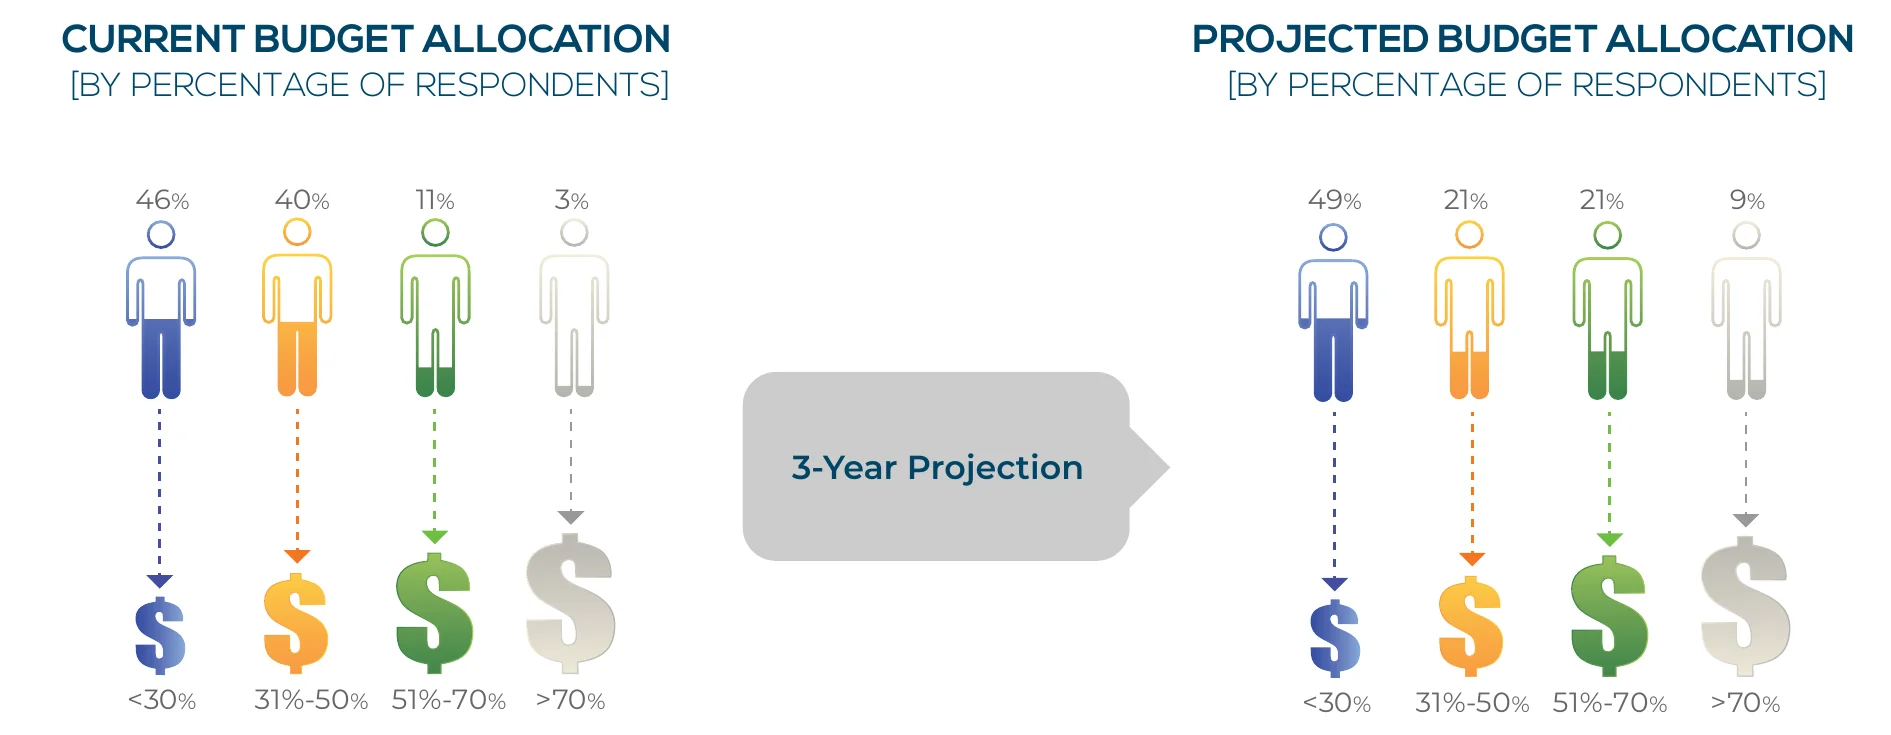
Digital Marketing Budget Allocation // Europe
Channel Spend
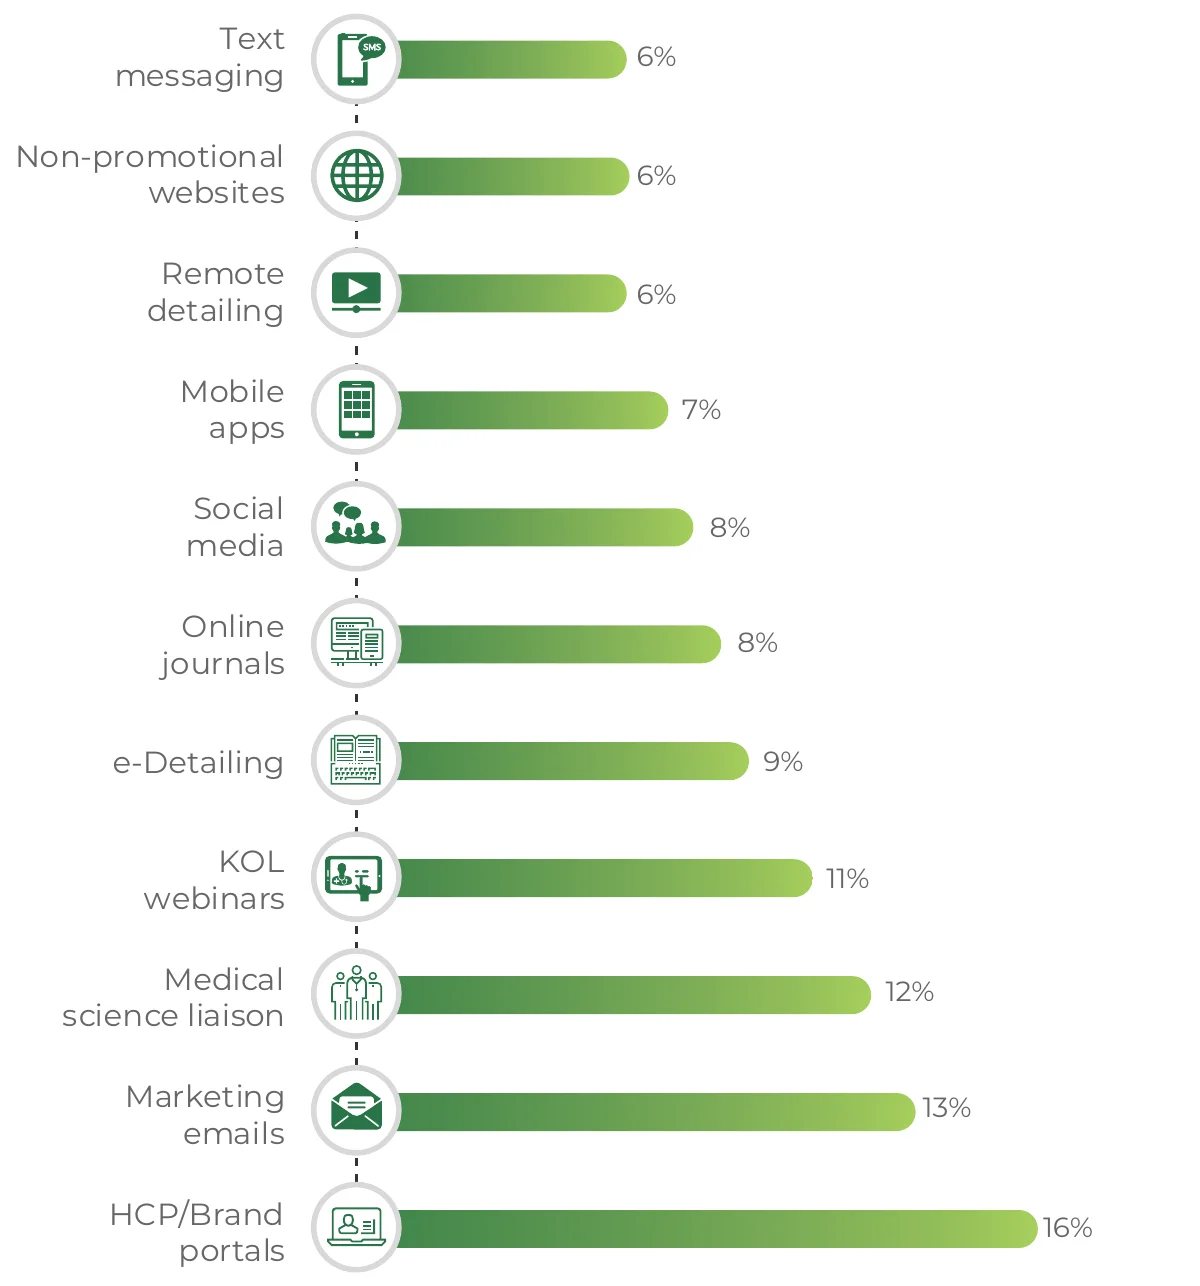
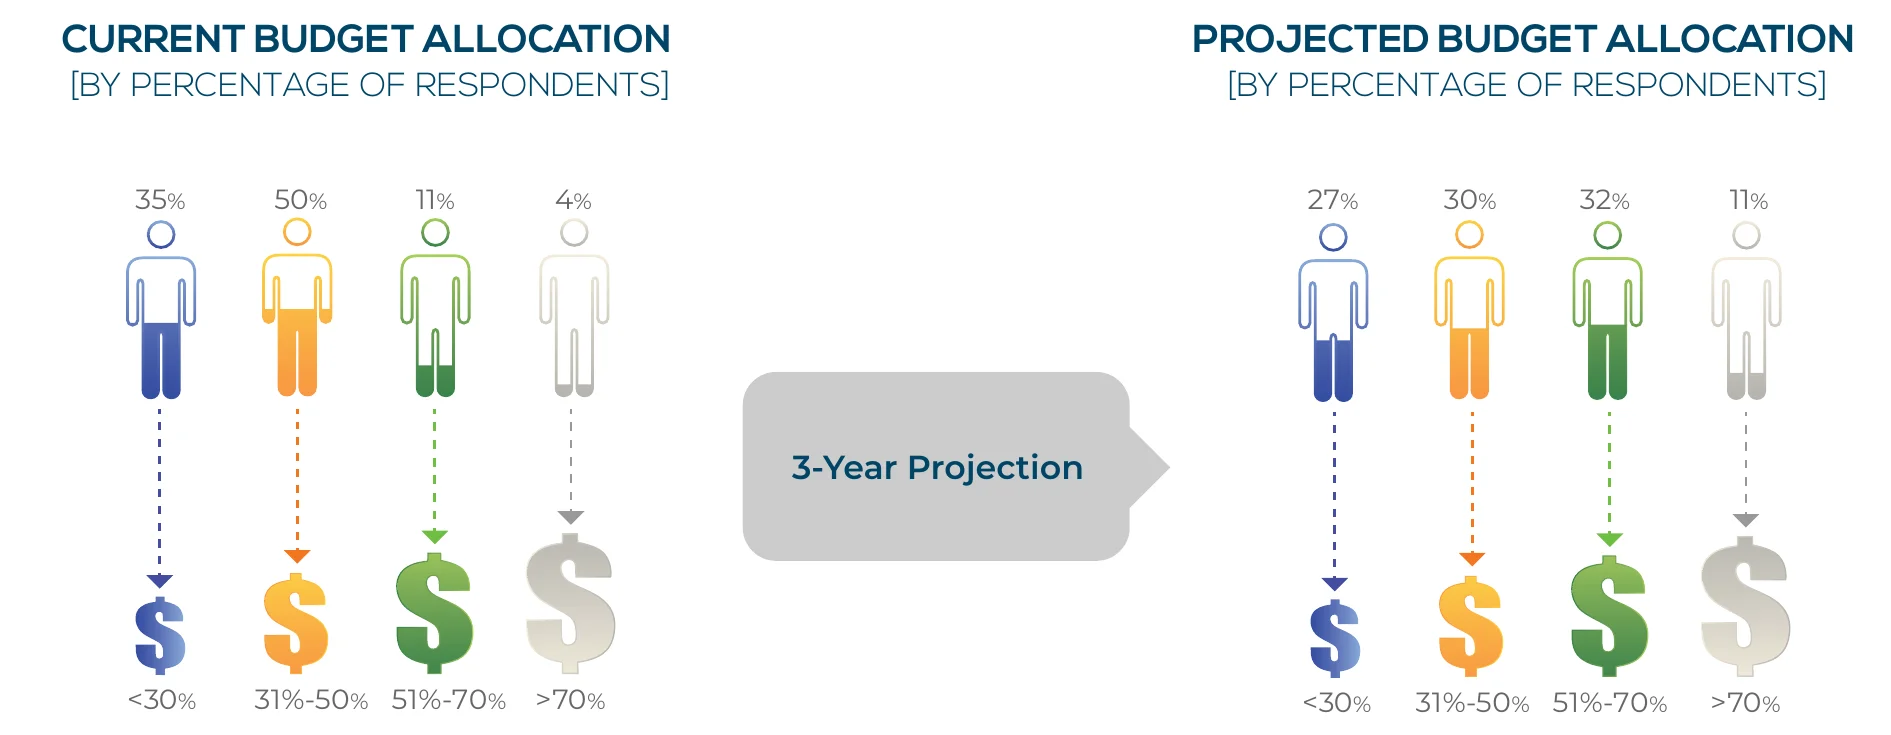
Digital Marketing Budget Allocation // Asia
Channel Spend
A Typical $100 Spend by Pharma Marketers
Key Takeaways:
On an average, the number of organizations that spend more than 20% of their budget on digital marketing channels is expected to increase by 31% over the next 3 years and by 73% over the next 6 years.
The budget increase pattern highlights how marketing organizations across the globe are undergoing a structural change
Primary Research
Engagements Trends – Content Strategies and Technology Adoption
Effective Content Strategies
Technology Adoption
Effective Content Strategies
Key Takeaways:
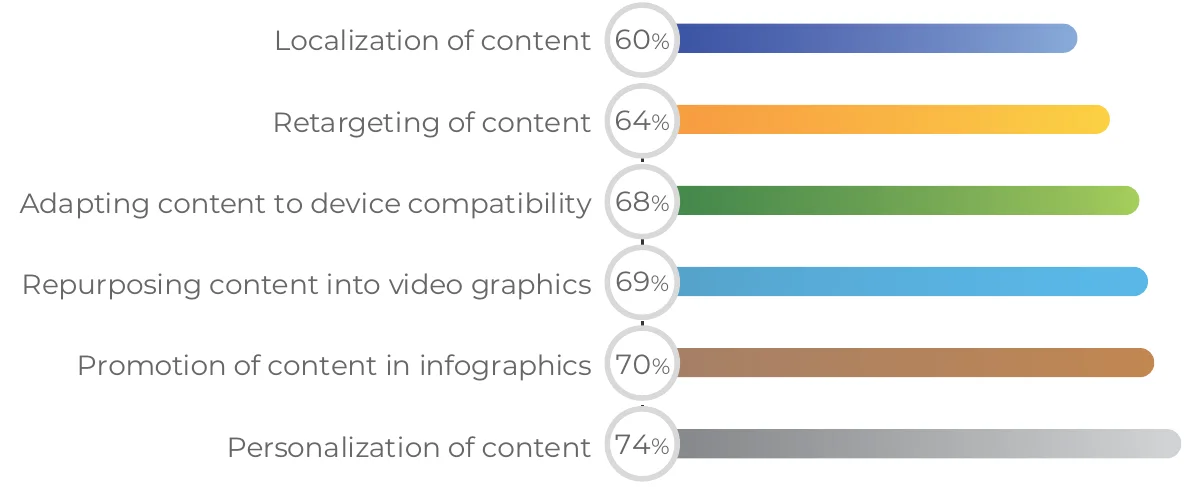
At the global level, personalization emerged as the top most effective content strategy for pharma marketers, followed by promotional infographics and repurposing of content into videographics.
Content personalization has generated the maximum returns for pharmaceutical companies as they grapple with reducing face-to-face engagements through their medical representatives.
Top 3 effective content strategies in
The Americas: Personalization of content, retargeting of content, and localization of content
Europe: Personalization of content, adapting content to device compatibility, and promotion of content through infographics
Asia: Personalization of content, repurposing content into videographics, and promotion of content through infographics
Content Strategies Utilized by Percentage of Pharma Marketers
Technology Adoption // Enterprise Capability
Key Takeaways:
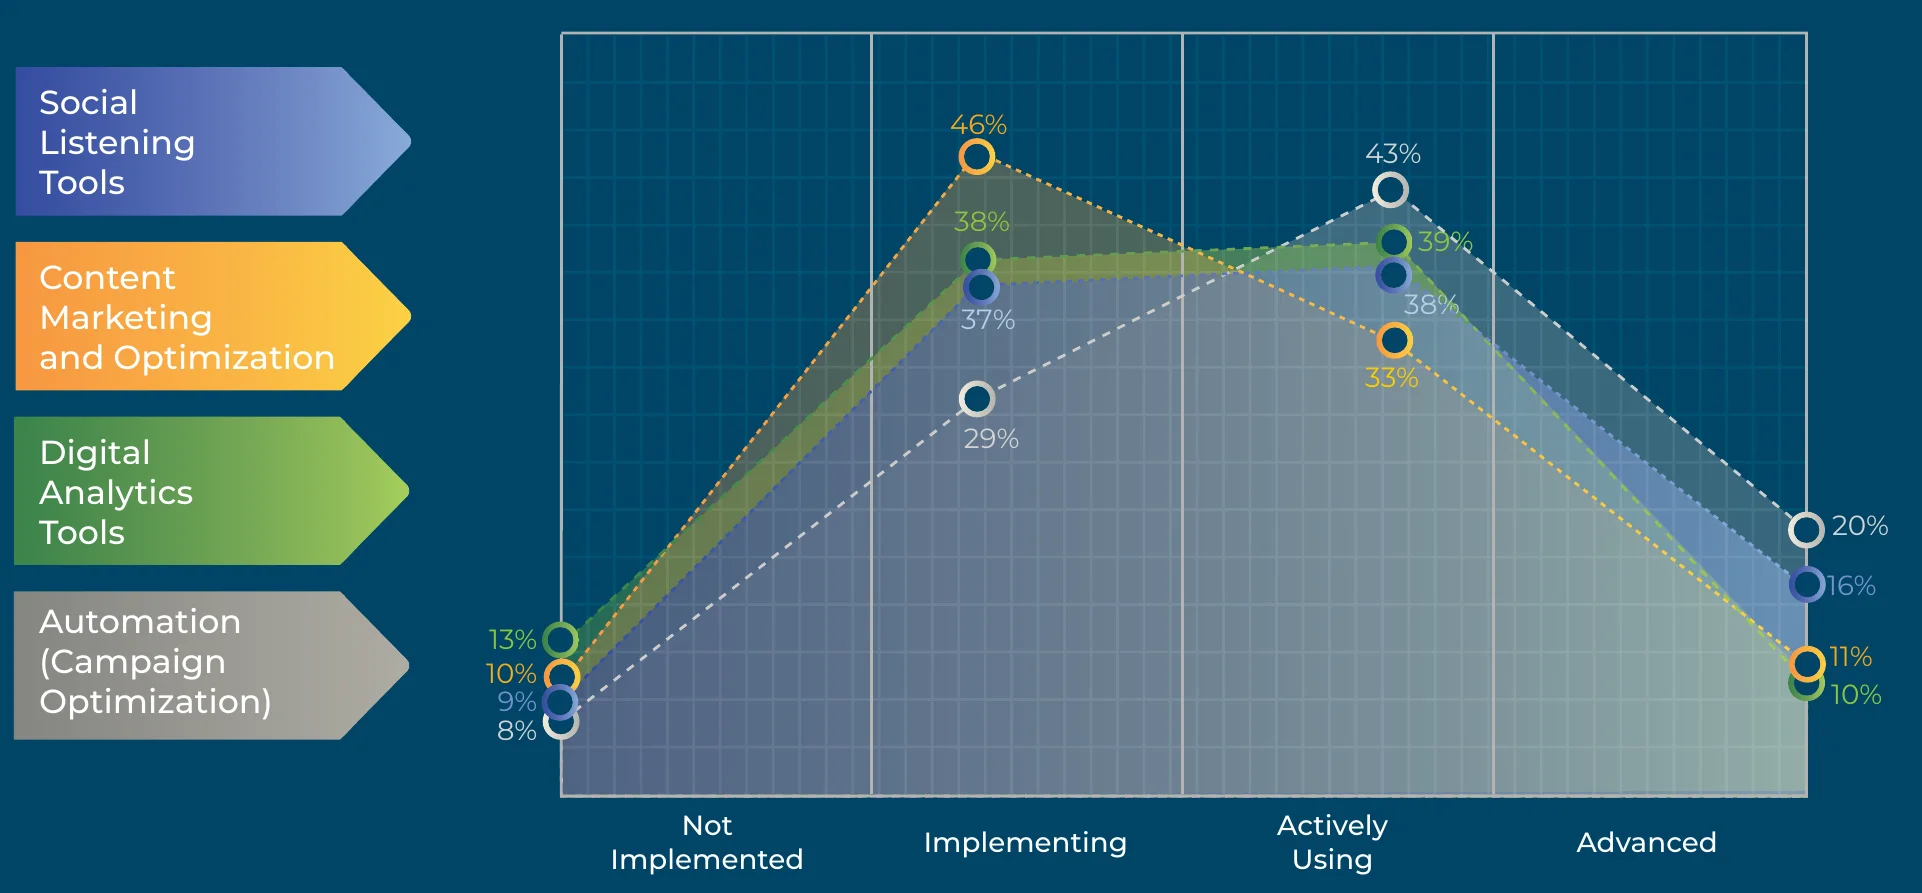
Marketing organizations have built up a suite of automation and analytics tools to push content through various digital channels. However, based on survey results, these companies utilize what is now considered as “staple” technology (such as campaign management) and need to scale up investments in advanced technologies.
Digital analytics tools seem to be the most popular technology choice among pharma marketers, with close to 65% stating it has already been implemented within their marketing stack.
Primary Research
Channel Preference – Marketer vs HCP
Channel Preference // Marketer vs HCP
Key Takeaways:
Top 3 channels preferred by HCPs: Online journals, websites, and KOL webinars
Top 3 channels preferred by pharma marketers: KOL webinars, social apps, and e-Detailing
Spend vs ROI – Greatest return: KOL webinars
Spend vs ROI – Least return: Social apps
Spend vs ROI – Balanced return: Marketing emails
Pharma marketers must focus on improving the availability of their content in journals and websites
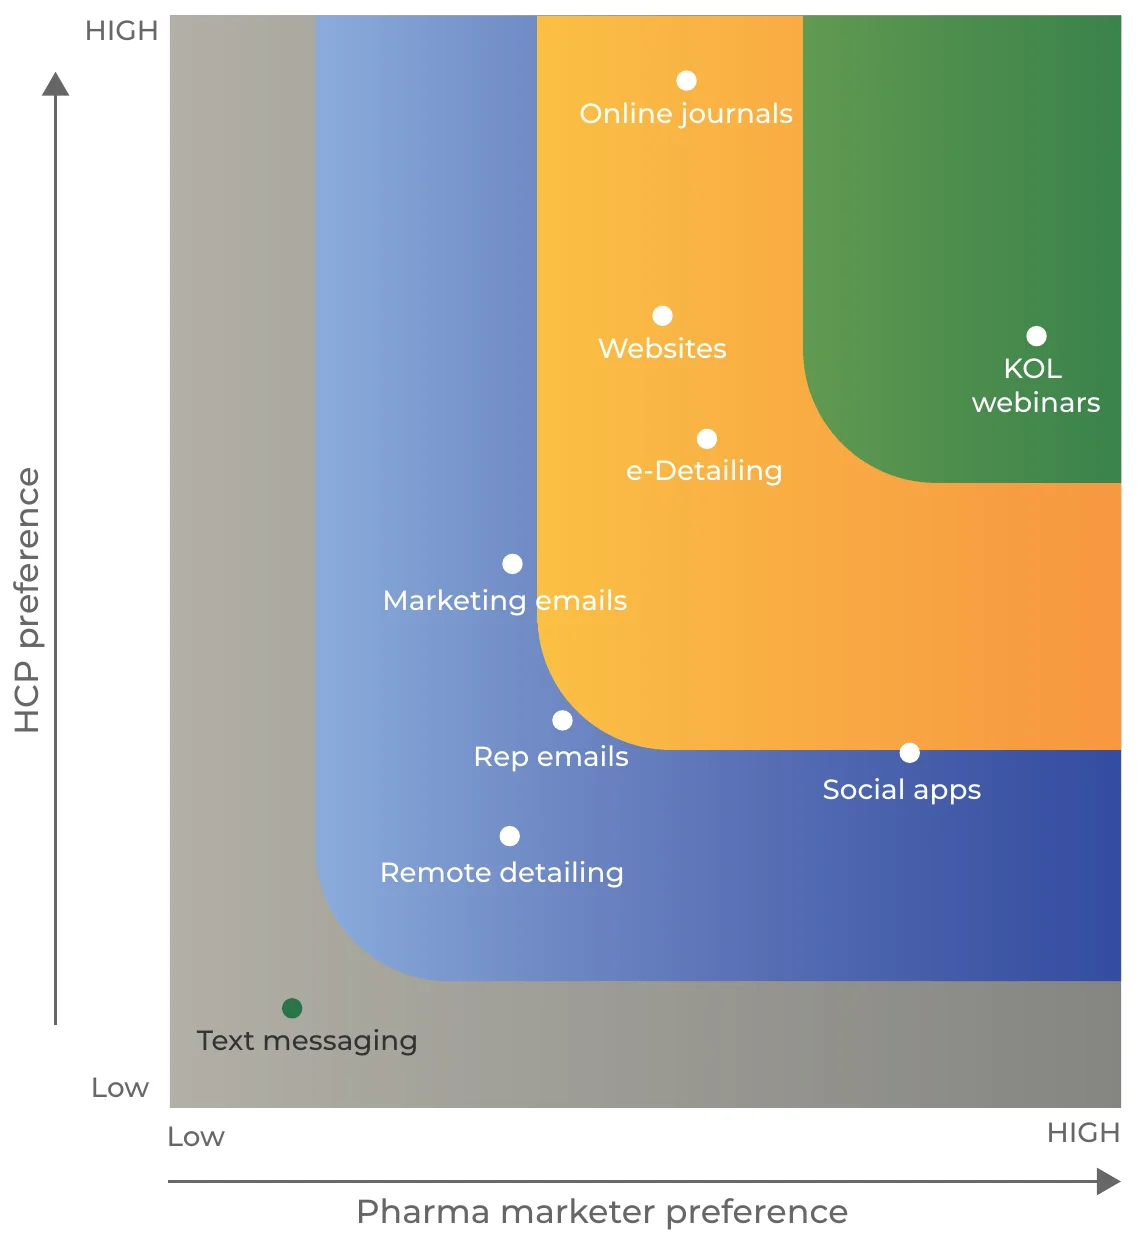
HCP Preference source - The Digital Savvy HCP Survey 2019
About Indegene
Indegene helps global healthcare organizations address complex challenges by seamlessly integrating analytics, technology, operations, and medical expertise. We help clients drive outcomes, revenue, and productivity improvements by making giant leaps in digital transformation, customer engagement, health reforms, healthcare cost reduction, and health outcomes improvement.
With offices in the US, Canada, UK, China, India, and Australia, Indegene can partner globally with clients; leverage a global talent pool of clinicians, technologists, domain experts, and business process specialists; deploy global infrastructure and proprietary IP assets; and harness global healthcare knowledge to solve complex industry challenges. Indegene works with over 100 global customers, including pharmaceutical and biotech companies, medical device manufacturers, life sciences organizations, health plans, health systems, ACOs, and provider organizations.
From Promise To Performance.
Trusted by all 20 of the world's top 20 pharmaceutical companies, Indegene helps life sciences organizations accelerate outcomes across the entire value chain.