Executive Summary
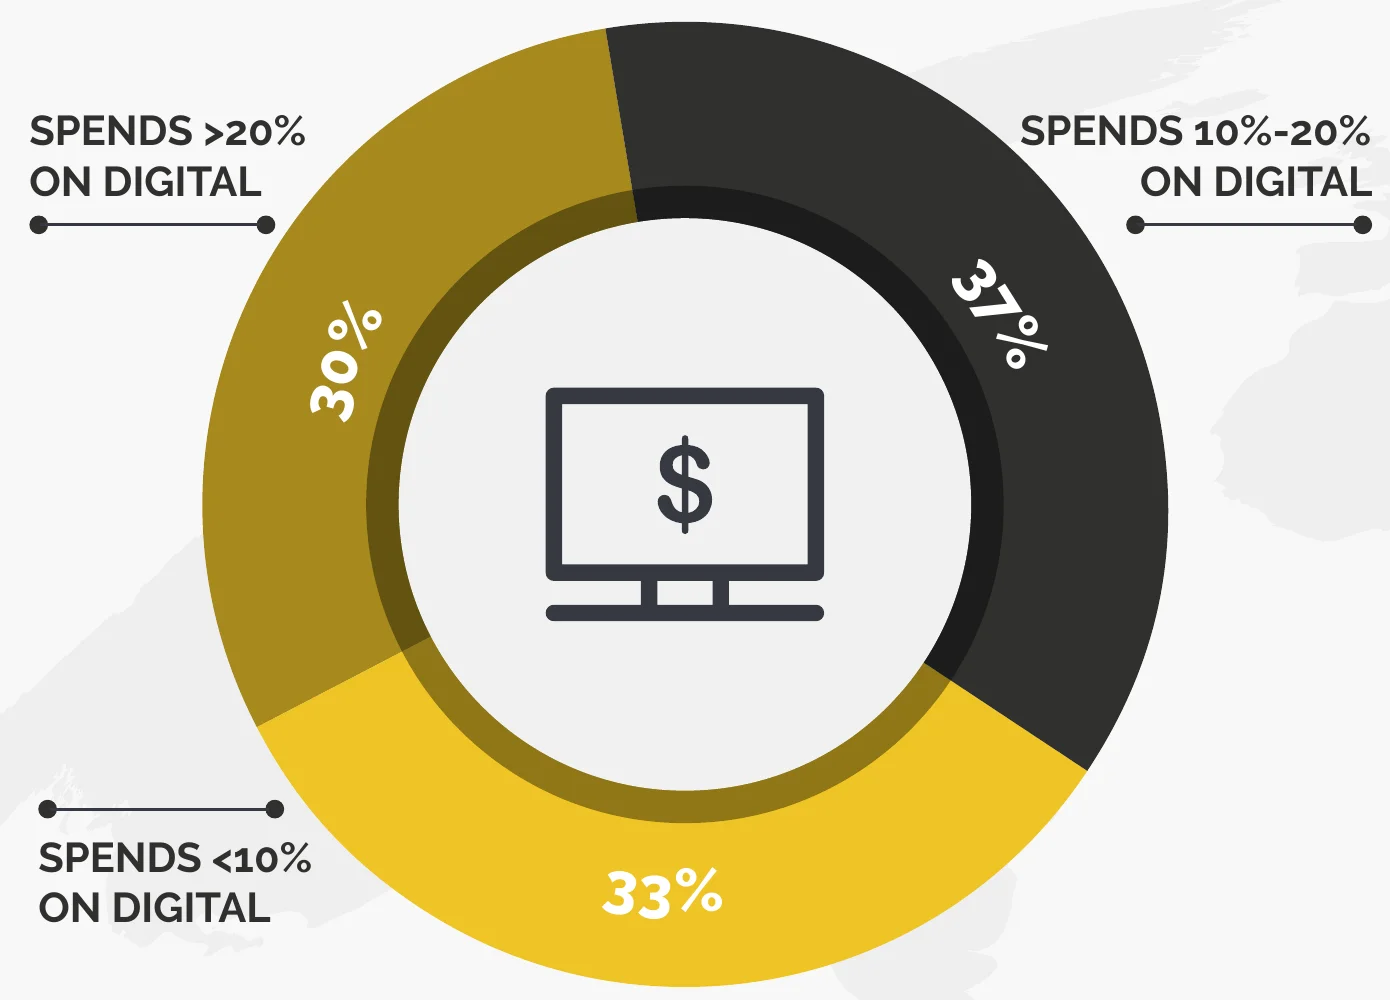
In 2016, the global pharma marketer spends an average of 14.85% on non-personal digital channels.
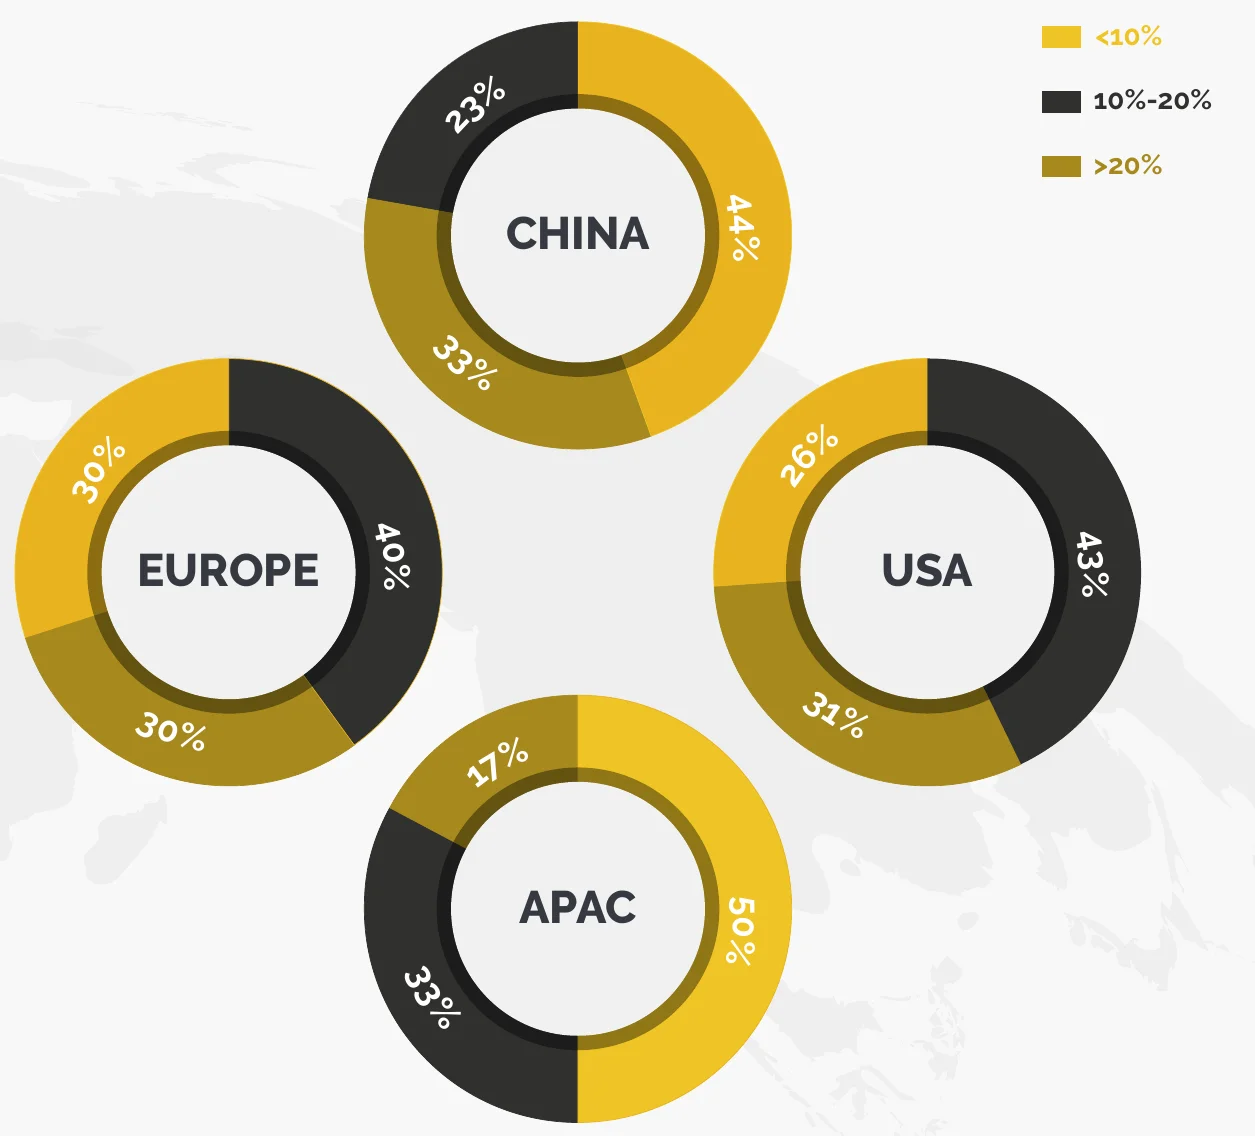
China and the USA are ahead of the curve in non-personal digital spend at 33% and 31%, respectively, spending over 20% annually.
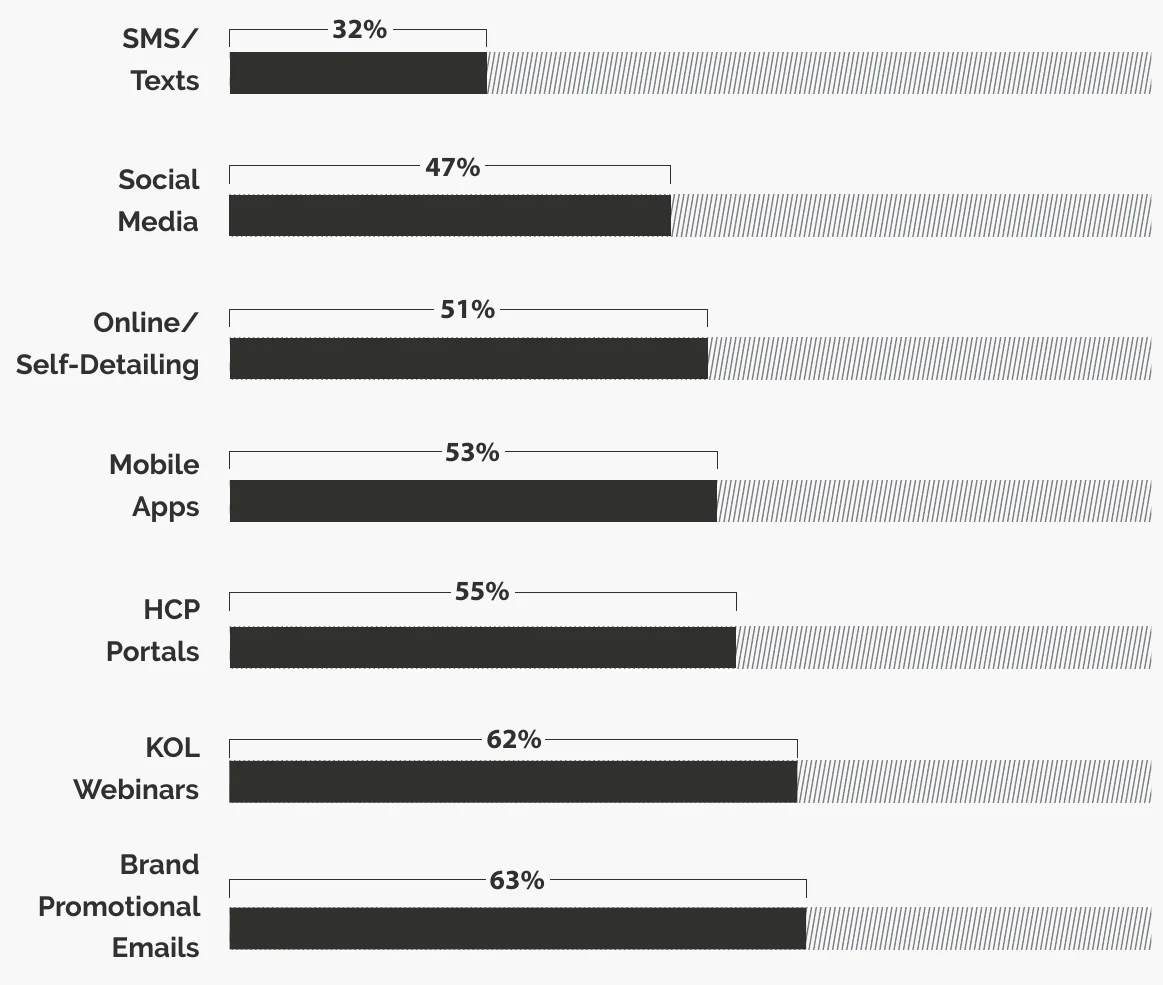
Currently, Brand Promotional Emails, KOL Webinars, and HCP Portals are the top 3 preferred channels by the global marketer to engage HCPs.
By 2018, it is predicted that the global pharma marketer will spend 19% of their marketing budgets on non-personal digital channels.
50% & 40% of marketers in China & USA spending more than 20% on digital channels.
By 2018, KOL Webinars, Social Media, and Mobile Apps are expected to become the most preferred channels of engagement.
The survey revealed that for every $100 spent on the digital budget by the global pharma marketer, $17 is spent on Brand Promotional Emails & KOL Webinars individually and $15 on HCP Portals among others.
KOL Webinars were identified as the most ROI-generating channel.
Research Scope
100+ pharma marketers of the top 40 lifescience companies responded across the USA, APAC, China, & Europe representing commercialization functions.
This report summarizes key trends in the digital landscape of lifescience companies pertaining to adoption of different channels for the engagement of healthcare professionals (HCPs).
Regional Mix
15%
Europe
25%
APAC
42%
USA
18%
China
01. Global Channel Preference in 2016
Describes the aggregate preference for each channel
Projected Global Channel Preference in 2018
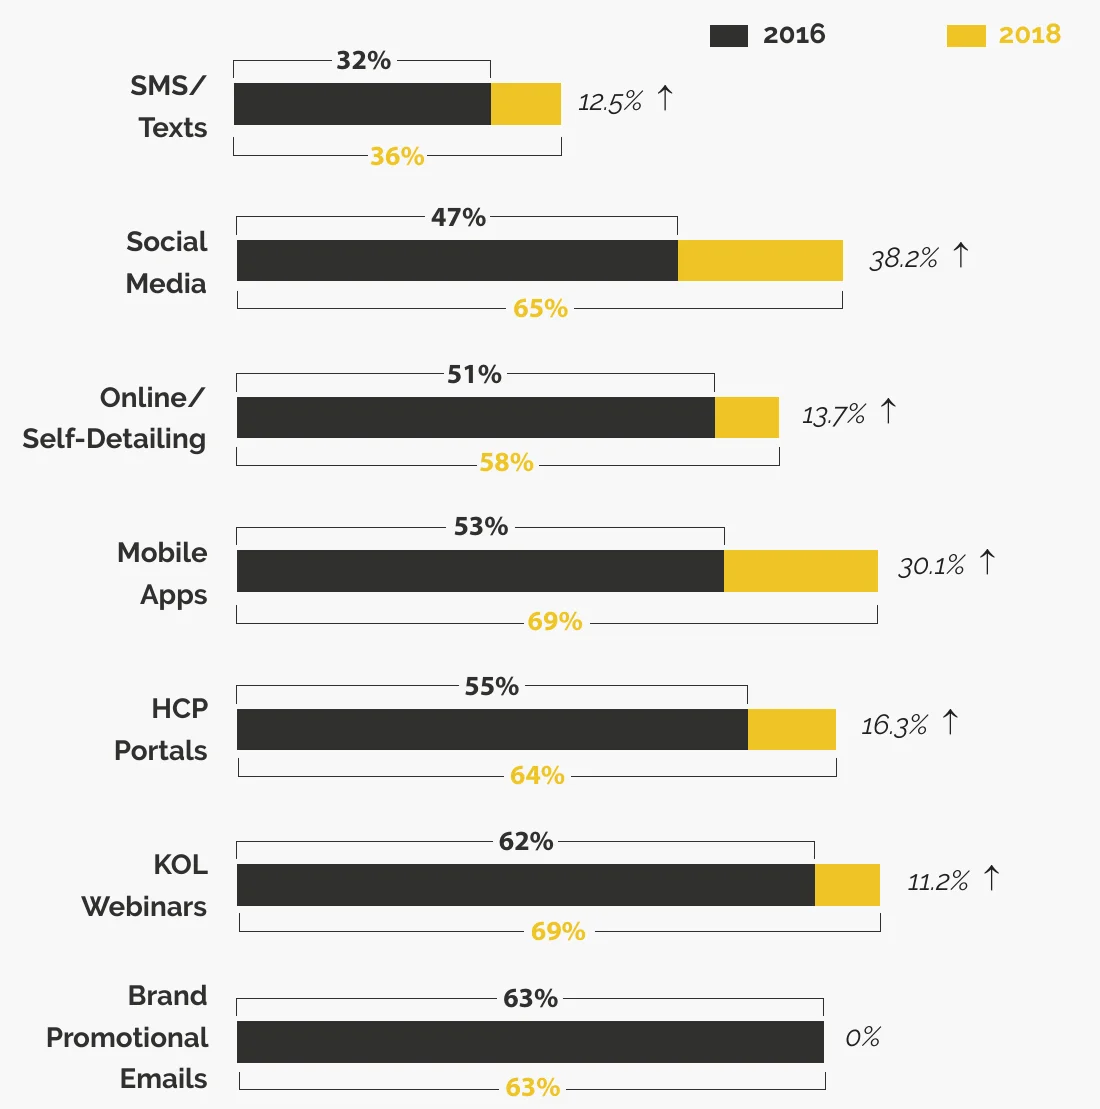
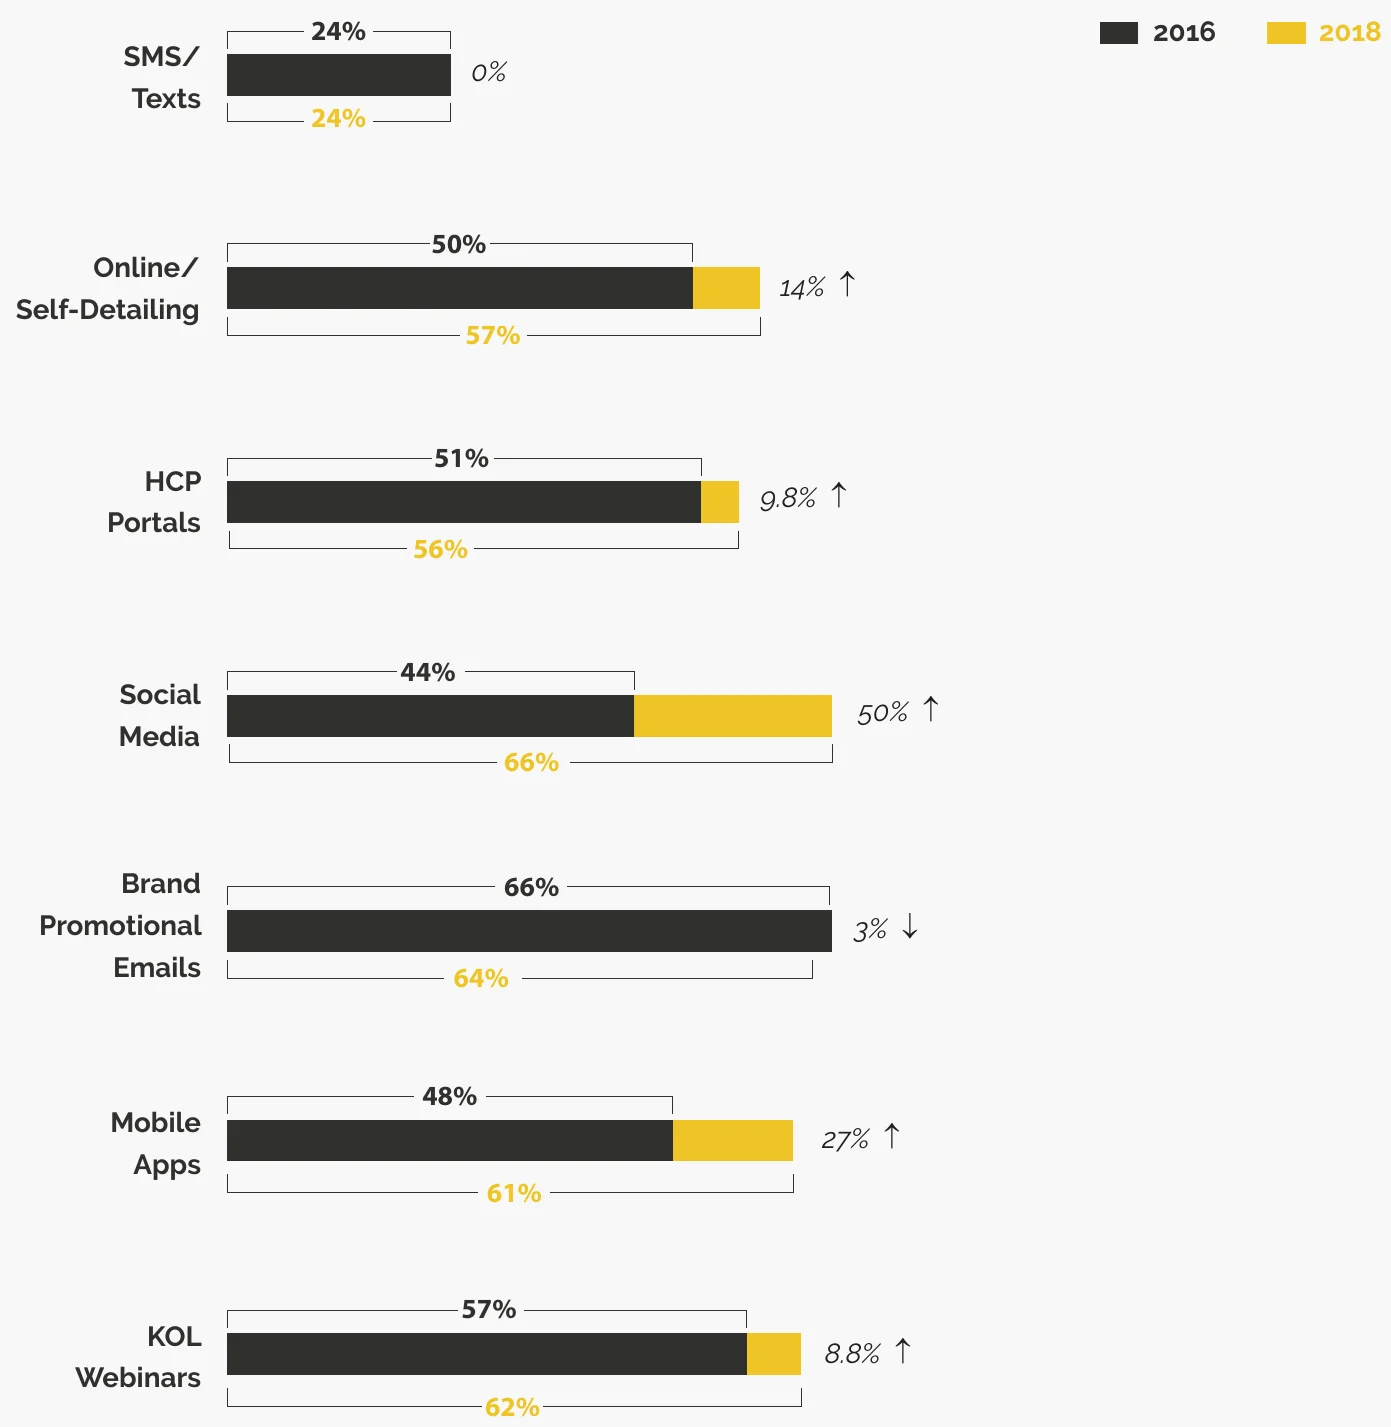
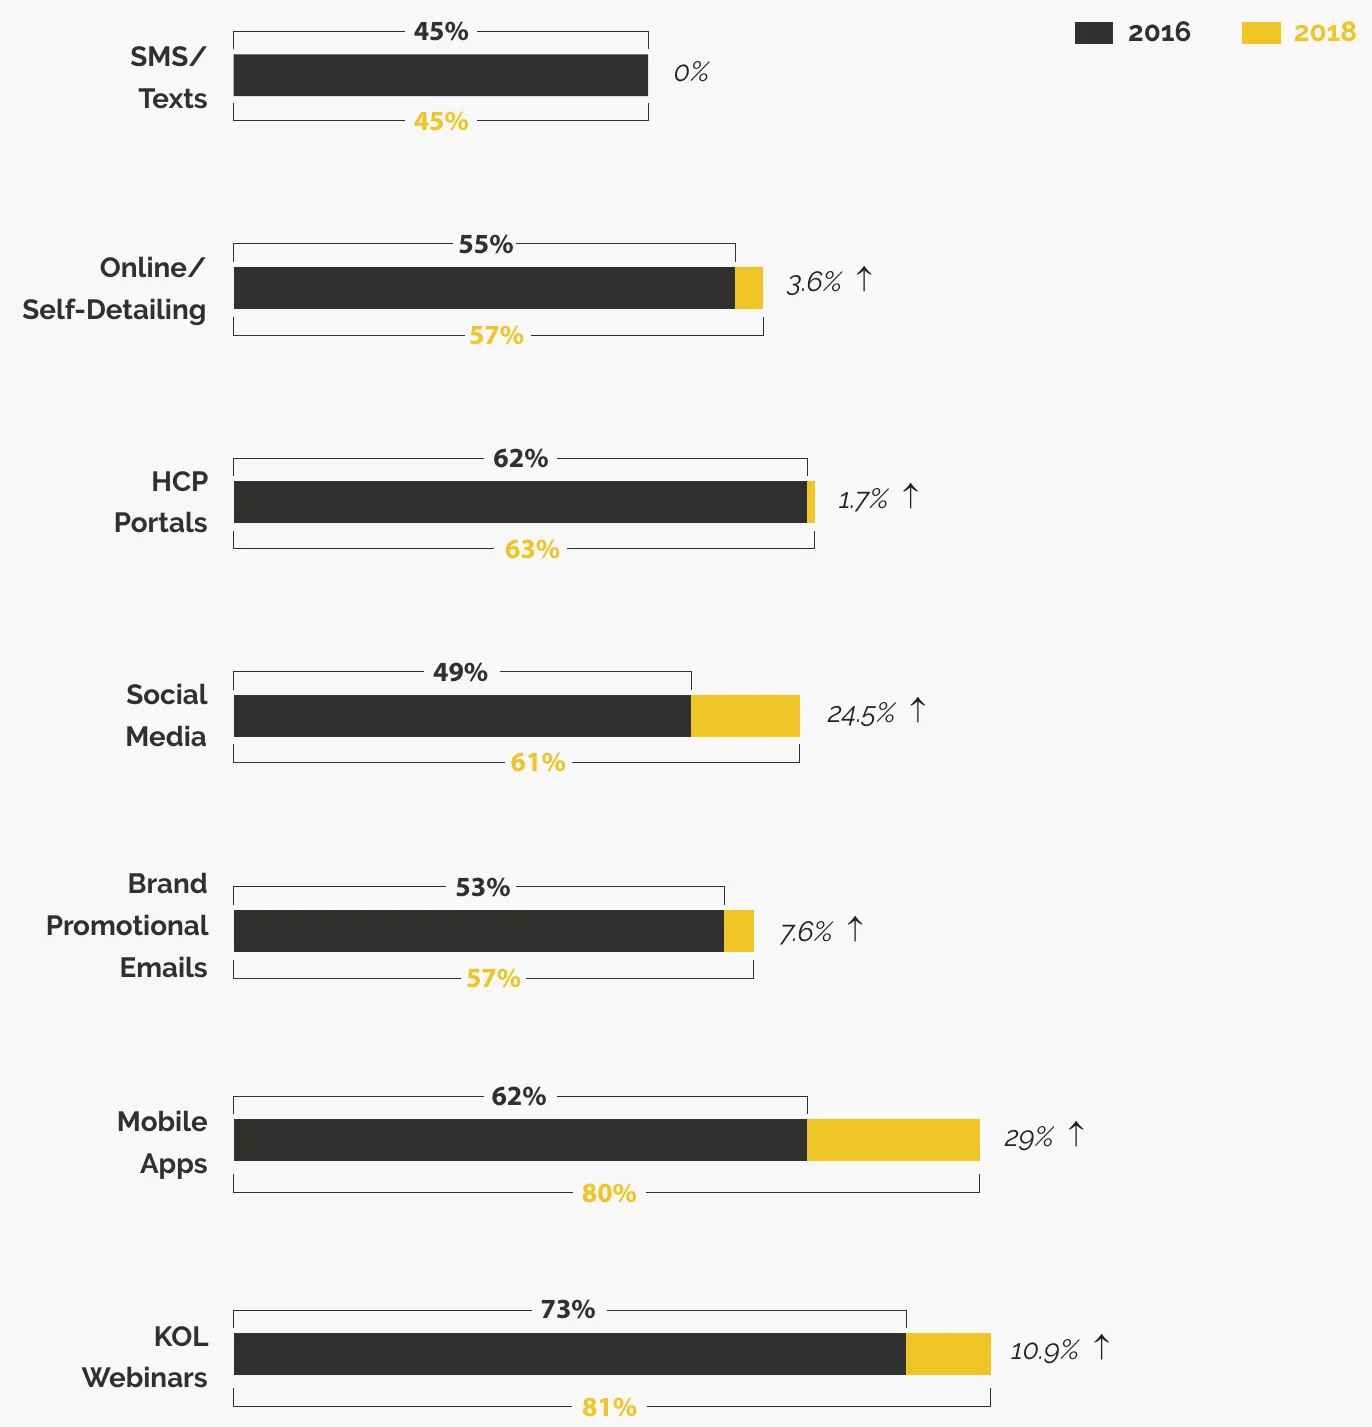
Increased worldwide usage of smartphones and mobile devices has opened up the possibilities of mobile social networks. We sight an increase in the preference of top 3 channels – Social Media, Mobile Apps, and HCP portals. Social media preference is poised to increase by 38.2% by 2018.
Currently, Brand Promotional Emails, KOL Webinars, and HCP Portals emerge as the top 3 preferred digital channels to engage HCPs
Channel Preferences in APAC
Channel Preferences in Europe
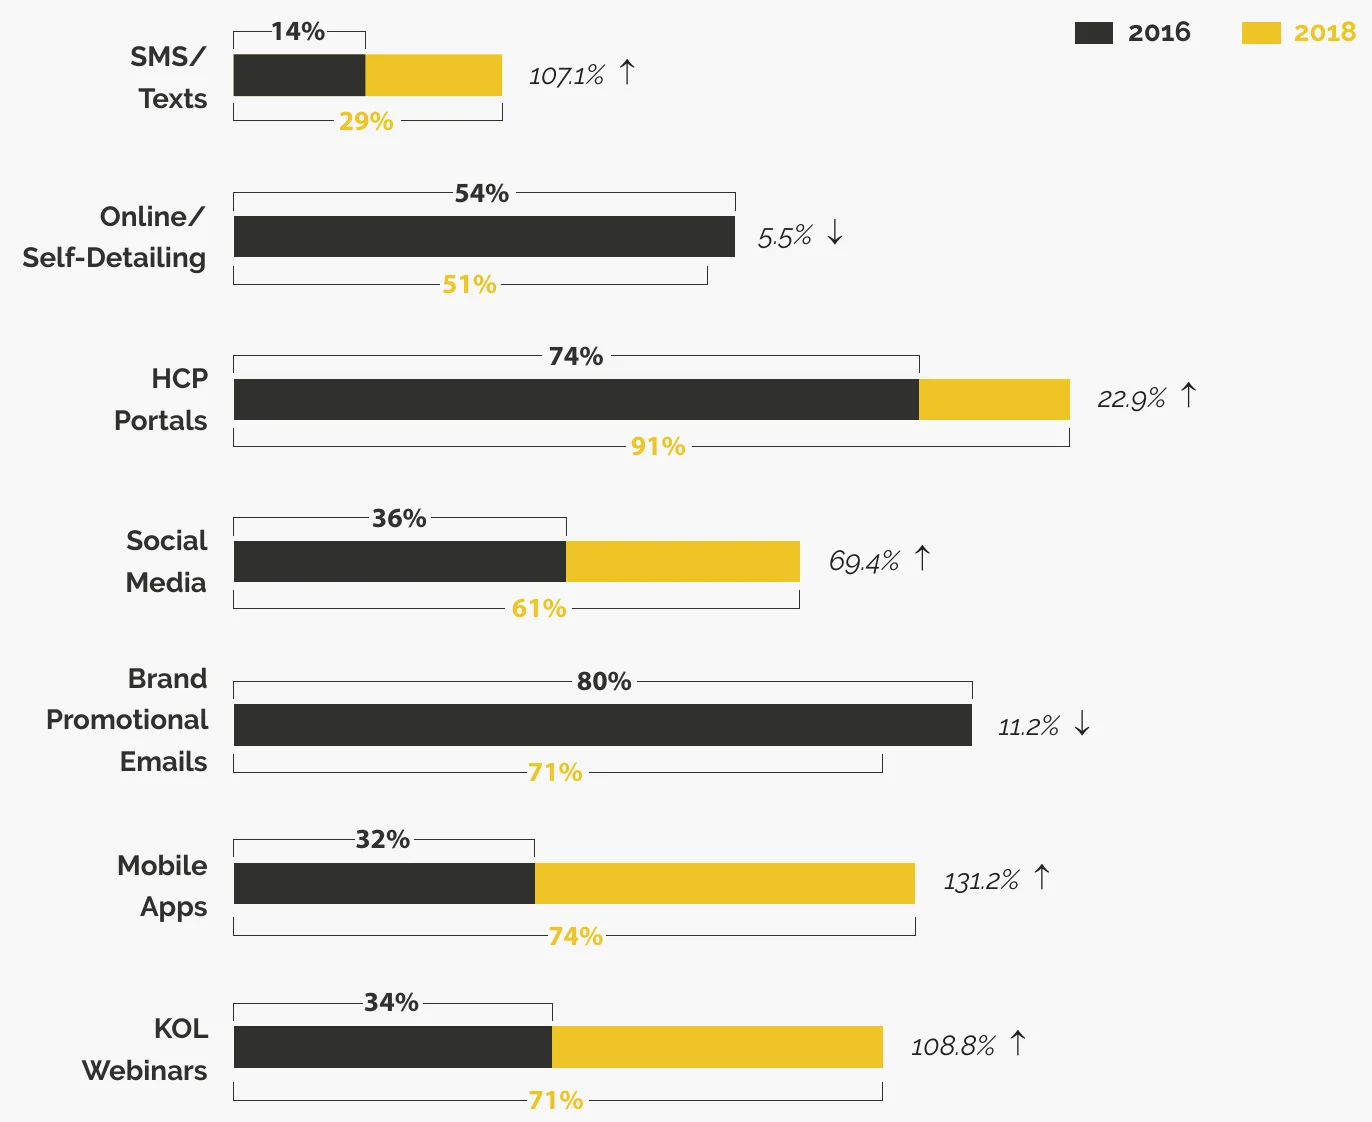
Mobile Apps, which have a relatively low score in 2016, is expected to grow by 131.2% by 2018
Channel Preferences in the USA
Channel Preferences in China
02. Global Digital Investment
Describes digital budget allocation as % of marketing budget
Digital Investment by Region
30%
of Marketers spend >20% of their overall marketing budget on Digital Initiatives
1 in 2
Marketers in APAC spend >10% of their overall budget on Digital Initiatives
Global Pharma Marketers’ Digital Spend – How a typical pharma marketer spends $100 on digital today
$ 12
Social Media
$ 14
Online/Self-Detailing
$ 14
Mobile Apps
$ 15
HCP Portals
$ 17
Brand Promotional Emails
$ 11
SMS/Texts
$ 17
KOL Webinars
Brand Promotional Emails, KOL Webinars and HCP Portals are the top spending channels preferred by marketers
03. Reach and ROI Indicators
Most preferred channels to reach HCPs
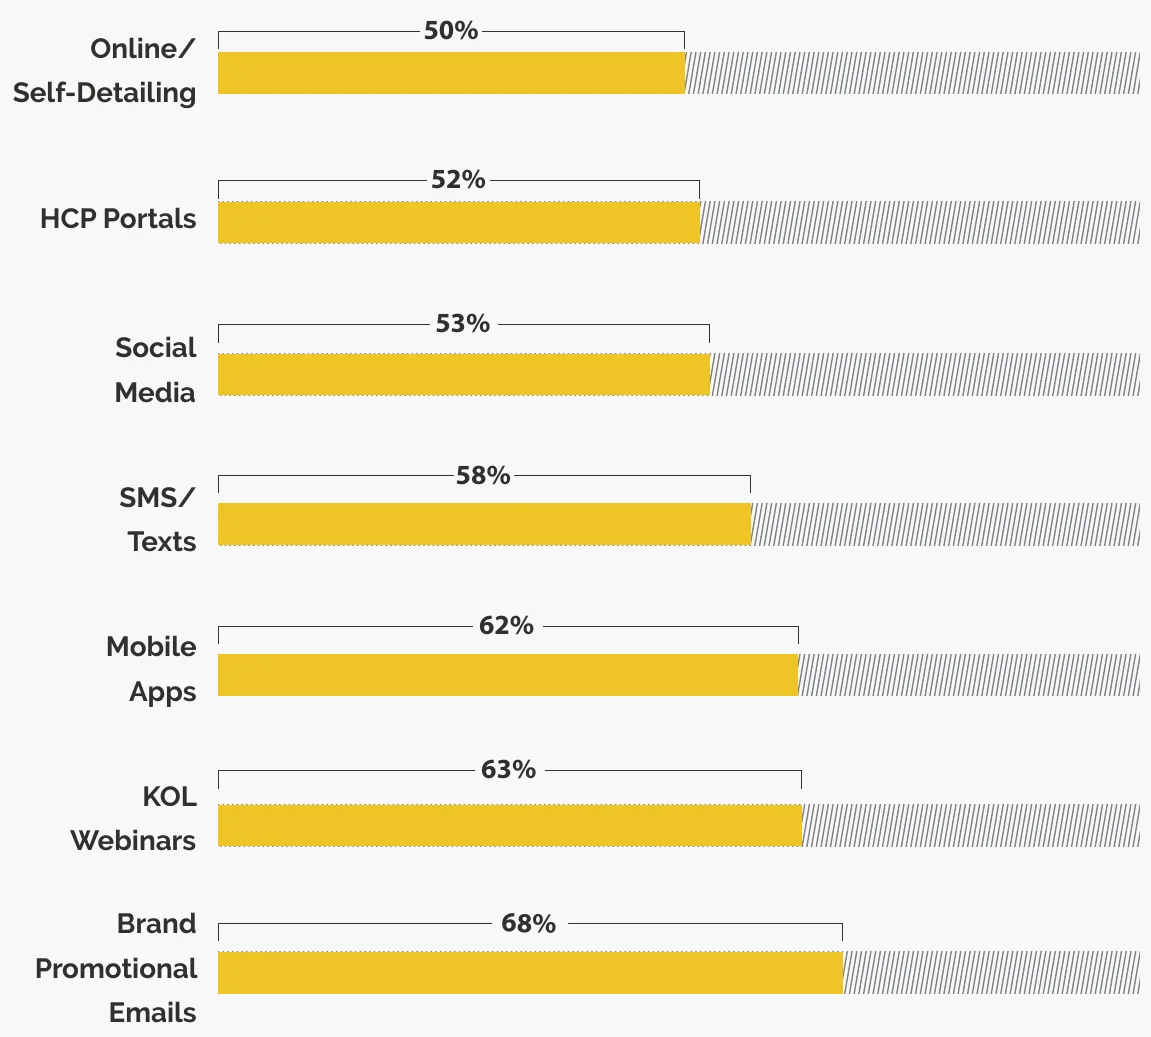
Brand Promotional Emails, KOL Webinar, Mobile Apps are the top 3 channels used to reach HCPs effectively
Highest ROI-generating channels
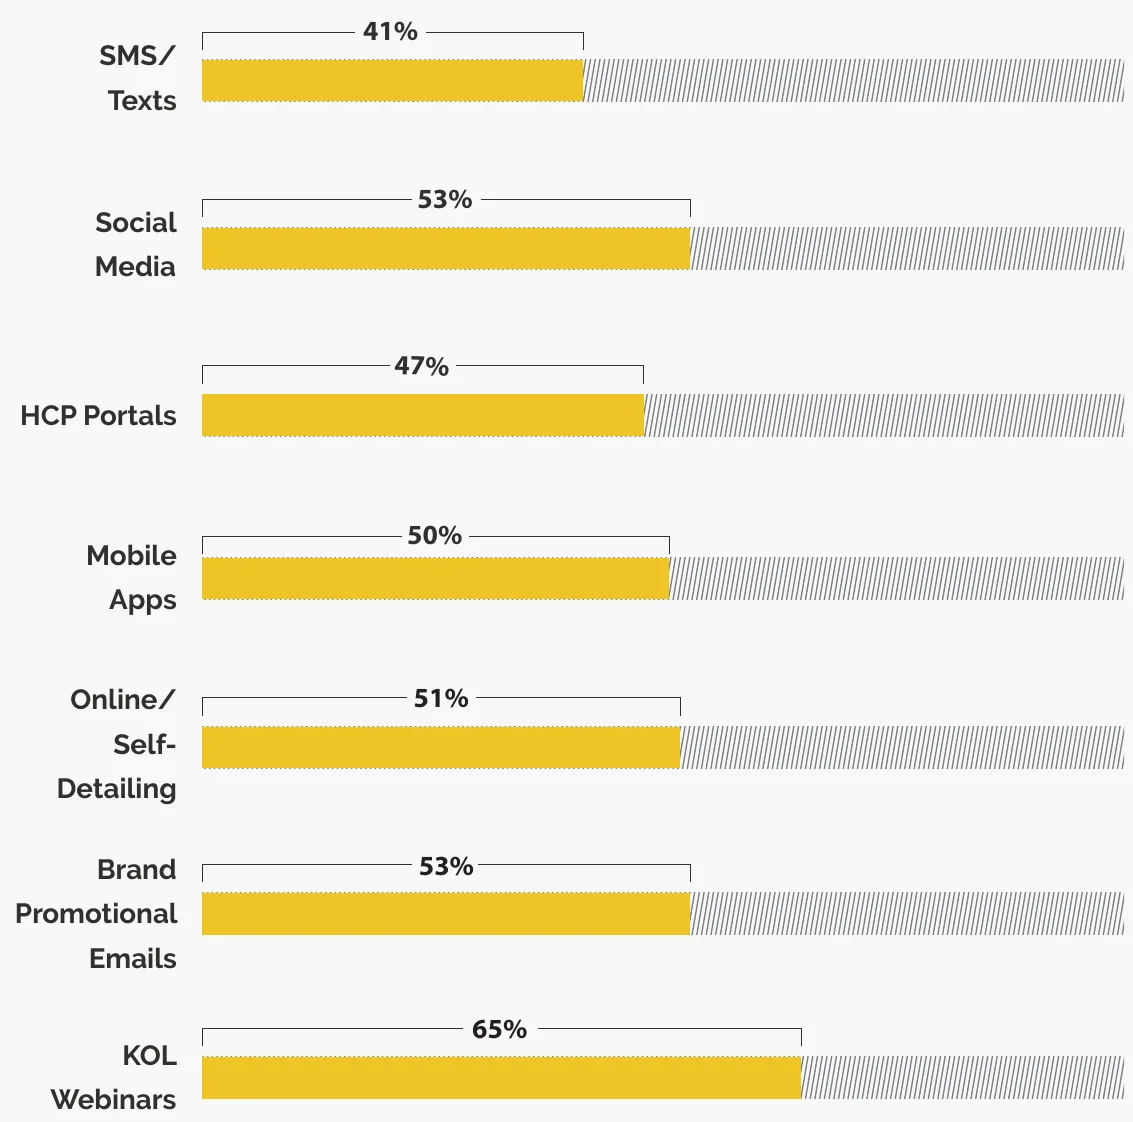
The highest ROI-generating channel was found to be KOL Webinars, followed by Brand Promotional Emails and Online/Self-Detailing.
KOL Webinars, Brand Promotional Emails, Online/Self-Detailing are the top 3 channels that create the highest ROI according to marketers
04. Challenges in Implementing Digital Programs
71%
Demonstrate ROI
60%
Response Rates
54%
Change Management
58%
Setup Costs
57%
System Integration
Demonstrating ROI has emerged to be the most important factor in deploying MCM programs. Setup costs are still important, but the research suggests that if ROI can be demonstrated, pharma marketers will make investments upfront.
7 in 10
consider measuring ROI a major barrier when deploying Digital Marketing Programs
From Promise To Performance.
Trusted by all 20 of the world's top 20 pharmaceutical companies, Indegene helps life sciences organizations accelerate outcomes across the entire value chain.